cover image

Petroleum in the United States

From Wikipedia, the free encyclopedia


Petroleum has been a major industry in the United States since shortly after the oil discovery in the Oil Creek area of Titusville, Pennsylvania in 1859. The industry includes exploration, production, processing (refining), transportation, and marketing of natural gas and petroleum products.[1] In 2018, the U.S. became the worlds largest crude oil producer, producing 15% of global crude oil, surpassing Russia and Saudi Arabia.[2] The leading oil-producing area in the United States in 2019 was Texas (5.07 million barrels (806,000 m3) per day), followed by the offshore federal zone of the Gulf of Mexico (1.90 million barrels (302,000 m3) per day), North Dakota (1.42 million barrels (226,000 m3) per day) and New Mexico (0.90 million barrels (143,000 m3) per day).[3] In 2020, the top five U.S. oil producing states were Texas (43%), North Dakota (10.4%), New Mexico (9.2%), Oklahoma (4.1%), and Colorado (4.0%).[2]

270px-US_crude_oil_production.webp.png
Crude oil production
Barrels of oil a day (average for the month)
270px-US_oil_production%2C_imports%2C_%26_exports.webp.png
US oil production, imports, & exports
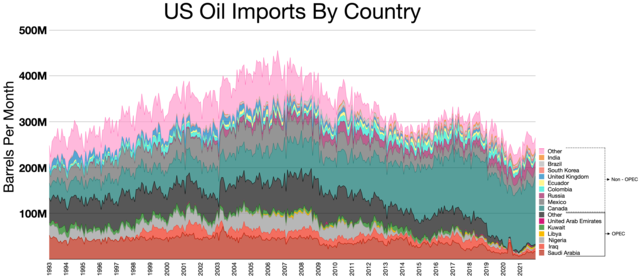
270px-Oil_imports_by_country.webp.png
Oil product imports by country
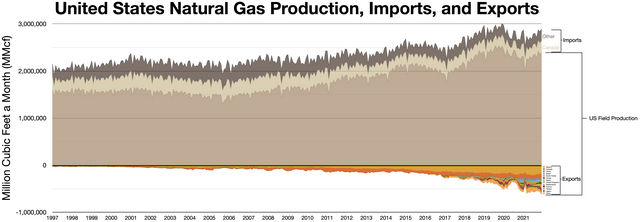
270px-US_Natural_Gas.webp.png
US natural gas production, imports, and exports
270px-Oil_companies_net_income.webp.png
Top 8 oil companies quarterly net income or net loss
Top_5_petroleum_states-large.jpg
Oil production by state 2021
US_historical_energy_consumption_1776-2018.svg
US energy consumption, by source, 1776–2018. Vertical axis is in quadrillion BTU.

The oil industry extracted a record high 4.47 billion barrels of crude oil in the United States in 2019[4] (around 12.25 million barrels per day),[5] worth an average wellhead price of US$55 per barrel.[6] U.S. oil production was 2.5 times as high in 2019 as it was in 2008 (when it reached its lowest level since 1946).

US Natural gas production achieved new record highs for each year from 2011 through 2014. Marketed natural gas production in 2014 was 74.7 billion cubic feet per day, a 44% increase over the rate of 51.9 billion cubic feet per day in 2005. Over the same time period, production of natural gas liquids increased 70%, from 1.74 million barrels per day in 2005 to 2.96 million barrels per day in 2014. In April 2015, natural gas was produced at the rate of 79.4 billion cubic feet per day.[7]

In 2014, petroleum and natural gas were the two largest sources of energy in the U.S., together providing 63 percent of the energy consumed (oil provided 35 percent and gas 28 percent).[8] In 2008 the United States consumed 19.5 million barrels (3,100,000 m3) per day of petroleum products, of which 46 percent was gasoline, 20 percent diesel fuel and heating oil, and 10 percent liquefied petroleum gas.[9] In 2020, the U.S. consumed about 18.19 million barrels per day, which was the lowest annual consumption rate since 1995. The cause of this decrease is largely attributed to the global response to the COVID-19 pandemic.[10] Petroleum and Natural gas made up 35% and 34% of U.S. energy consumption in 2020.[11]

2020_U.S._Primary_Energy_Consumption_Chart.png
U.S. primary energy consumption by energy source

In 2019, the U.S. imported 9% of the petroleum it used, the lowest since 1957. The largest sources of U.S. imported oil were: Canada (49%), Mexico (7%), Saudi Arabia (6%), Russia (6%), and Colombia (4%).[12]

According to the American Petroleum Institute, the oil and natural gas industry supports nine million U.S. jobs and makes up seven percent of the nation's gross domestic product.[13] As of 2021, the petroleum and natural gas industries support 10.3 million jobs and make up 8% of the U.S. GDP.[14]