The ceremonial county of Hampshire, which includes the unitary authorities of Portsmouth and Southampton, is divided into 18 parliamentary constituencies: 9 borough constituencies and 9 county constituencies.
Constituencies
Conservative † Labour ‡ Liberal Democrat ¤


Proposed boundary changes
2024
| Former name | Boundaries 1997–2010 | Current name | Boundaries 2010–present |
|---|---|---|---|
|
 |
|
 |
See 2023 Periodic Review of Westminster constituencies for further details.
Following the abandonment of the Sixth Periodic Review (the 2018 review), the Boundary Commission for England formally launched the 2023 Review on 5 January 2021.[1] Initial proposals were published on 8 June 2021 and, following two periods of public consultation, revised proposals were published on 8 November 2022. The final proposals were published on 28 June 2023.
The commission opted to combine Hampshire with Berkshire and Surrey as a sub-region of the South East Region. As a result, parts of the current constituency of East Hampshire were transferred to a new cross-county boundary constituency named Farnham and Bordon. In addition, Fareham and Meon Valley was abolished and replaced by the new constituencies of Fareham and Waterlooville, and Hamble Valley.[2][3]
The following constituencies are proposed:
Containing electoral wards from Basingstoke and Deane
- Basingstoke
- East Hampshire (part)
- North East Hampshire (part)
- North West Hampshire (part)
Containing electoral wards from East Hampshire
- East Hampshire (part)
- Farnham and Bordon (also includes part in the Surrey borough of Waverley)
Containing electoral wards from Eastleigh
- Eastleigh (part)
- Hamble Valley (part)
Containing electoral wards from Fareham
- Fareham and Waterlooville (part)
- Gosport (part)
- Hamble Valley (part)
Containing electoral wards from Gosport
- Gosport (part)
Containing electoral wards from Hart
- Aldershot (part)
- North East Hampshire (part)
Containing electoral wards from Havant
- Fareham and Waterlooville (part)
- Havant
Containing electoral wards from New Forest
Containing electoral wards from Portsmouth
Containing electoral wards from Rushmoor
- Aldershot (part)
Containing electoral wards from Southampton
Containing electoral wards from Test Valley
- Eastleigh (part)
- North West Hampshire (part)
- Romsey and Southampton North (part)
Containing electoral wards from Winchester
- Fareham and Waterlooville (part)
- Hamble Valley (part)
- Winchester
2010
Under the Fifth Periodic Review of Westminster constituencies, the Boundary Commission for England decided to increase the number of seats which covered Hampshire from 17 to 18, with the creation of Meon Valley. As a consequence of resulting boundary changes, Romsey was renamed Romsey and Southampton North. The Aldershot and Basingstoke seats, more predominantly urban than previously defined, were redesignated as borough constituencies.
| 19997-2010 name | Boundaries 1997–2010 | 2010–2024 name | Boundaries 2010–2024 |
|---|---|---|---|
 |
|
| |
Results history
Primary data source: House of Commons research briefing – General election results from 1918 to 2019.[4] The Isle of Wight is excluded throughout.
2019
The number of votes cast for each political party who fielded candidates in constituencies comprising Hampshire in the 2019 general election were as follows:
| Party | Votes | % | Change from 2017 | Seats | Change from 2017 |
|---|---|---|---|---|---|
| Conservative | 536,633 | 57.1% | 16 | 0 | |
| Labour | 188,738 | 20.1% | 2 | 0 | |
| Liberal Democrats | 175,173 | 18.6% | 0 | 0 | |
| Greens | 30,710 | 3.3% | 0 | 0 | |
| Brexit | 2,585 | 0.3% | new | 0 | 0 |
| Others | 6,473 | 0.6% | 0 | 0 | |
| Total | 940,312 | 100.0 | 18 |
Percentage votes
Note that before 1983 Hampshire also included the Bournemouth and Christchurch areas.
| Election year | 1923 | 1924 | 1929 | 1935 | 1945 | 1950 | 1951 | 1955 | 1959 | 1964 | 1966 | 1970 | 1974 (F) | 1974 (O) | 1979 | 1983 | 1987 | 1992 | 1997 | 2001 | 2005 | 2010 | 2015 | 2017 | 2019 |
|---|---|---|---|---|---|---|---|---|---|---|---|---|---|---|---|---|---|---|---|---|---|---|---|---|---|
| Conservative1 | 50.2 | 63.8 | 46.9 | 68.0 | 49.5 | 54.3 | 58.1 | 60.0 | 60.6 | 50.5 | 47.4 | 52.0 | 46.5 | 45.9 | 56.1 | 55.1 | 55.3 | 54.2 | 41.2 | 41.6 | 42.8 | 49.5 | 52.2 | 56.6 | 57.1 |
| Labour | 22.7 | 27.1 | 27.2 | 27.4 | 37.7 | 38.8 | 40.3 | 38.1 | 34.9 | 34.1 | 33.7 | 29.9 | 26.9 | 29.4 | 26.1 | 14.7 | 14.5 | 18.6 | 28.3 | 27.6 | 23.2 | 14.9 | 16.9 | 26.6 | 20.1 |
| Liberal Democrat2 | 27.0 | 9.1 | 23.7 | 3.1 | 6.9 | 6.7 | 1.6 | 1.9 | 4.6 | 15.3 | 13.7 | 12.1 | 26.0 | 24.0 | 17.3 | 29.9 | 30.0 | 26.0 | 25.3 | 27.8 | 29.6 | 29.7 | 11.3 | 12.2 | 18.6 |
| Green Party | – | – | – | – | – | – | – | – | – | – | – | – | – | – | – | – | * | * | * | * | * | 0.7 | 4.3 | 2.0 | 3.3 |
| UKIP | – | – | – | – | – | – | – | – | – | – | – | – | – | – | – | – | – | – | * | * | * | 3.9 | 14.7 | 2.0 | * |
| Brexit Party | – | – | – | – | – | – | – | – | – | – | – | – | – | – | – | – | – | – | – | – | – | – | – | – | 0.3 |
| Other | – | – | 2.2 | 1.5 | 5.9 | 0.3 | – | – | – | 0.04 | 5.1 | 6.0 | 0.7 | 0.8 | 0.5 | 0.2 | 0.2 | 1.2 | 5.1 | 3.0 | 4.4 | 1.3 | 0.5 | 0.6 | 0.6 |
1Including National Liberal, and one National candidate in 1945
2pre-1979: Liberal Party; 1983 & 1987 – SDP-Liberal Alliance
* Included in Other
Accurate vote percentages for the 1918, 1922 and 1931 elections cannot be obtained because at least one candidate stood unopposed.
Seats
| Election year | 1983 | 1987 | 1992 | 1997 | 2001 | 2005 | 2010 | 2015 | 2017 | 2019 |
|---|---|---|---|---|---|---|---|---|---|---|
| Conservative | 15 | 15 | 14 | 11 | 10 | 10 | 14 | 17 | 16 | 16 |
| Labour | 0 | 0 | 1 | 3 | 3 | 3 | 2 | 1 | 2 | 2 |
| Liberal Democrat1 | 0 | 0 | 0 | 3 | 4 | 4 | 2 | 0 | 0 | 0 |
| Total | 15 | 15 | 15 | 17 | 17 | 17 | 18 | 18 | 18 | 18 |
11983 & 1987 – SDP-Liberal Alliance
Maps
1885–1910
 1885
1885 1886
1886 1892
1892 1895
1895 1900
1900 1906
1906 Jan 1910
- Dec 1910


1918–1945
 1918
1918 1922
1922 1923
1923 1924
1924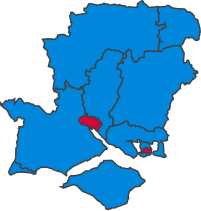 1929
1929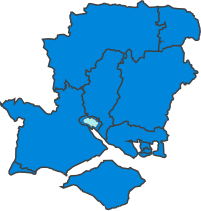 1931
1931- 1935
 1945
1945


1950–1979
 1950
1950- 1951
 1955
1955- 1959
- 1964
 1966
1966 1970
1970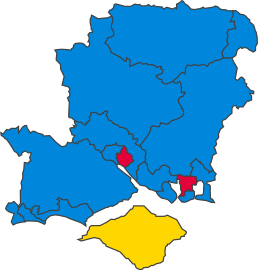 1974 (Feb)
 1974 (Oct)
 1979
1979


1983–present
 1983
1983- 1987
 1992
1992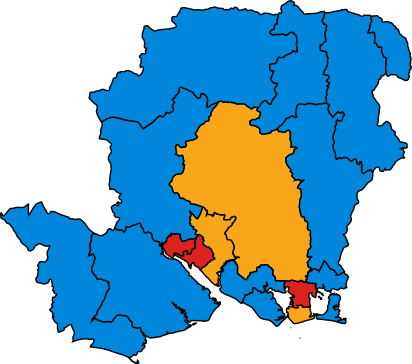 1997
1997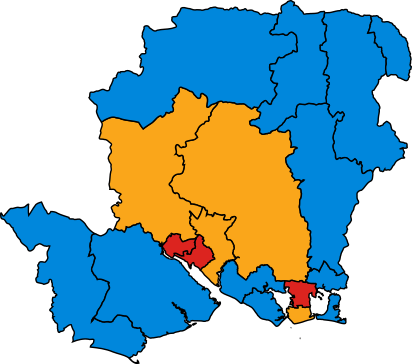 2001
2001- 2005
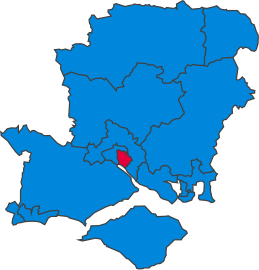
 2010
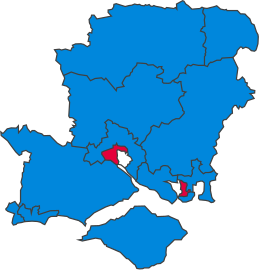
2010 2015
2015 2017
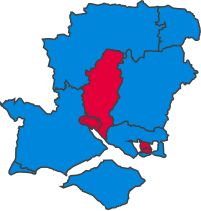
2017- 2019
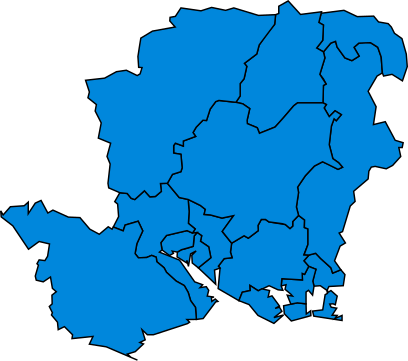
 2024
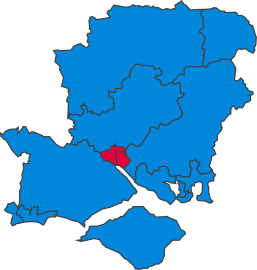
2024


Historical representation by party
A cell marked → (with a different colour background to the preceding cell) indicates that the previous MP continued to sit under a new party name. Unlike elsewhere in this article, the Isle of Wight is included in these tables.
1885 to 1918
Conservative Independent Conservative Liberal Liberal Unionist National Party
| Constituency | 1885 | 1886 | 87 | 88 | 1892 | 1895 | 96 | 97 | 00 | 1900 | 01 | 04 | 05 | 1906 | 06 | Jan 10 | Dec 10 | 12 | 16 | 17 | 18 |
|---|---|---|---|---|---|---|---|---|---|---|---|---|---|---|---|---|---|---|---|---|---|
| Andover | Beach | E. Faber | W. Faber | ||||||||||||||||||
| Basingstoke | Sclater-Booth | Jeffreys | Salter | Geddes | |||||||||||||||||
| Christchurch | Young | Smith | Balfour | Allen | Croft | Croft | |||||||||||||||
| Fareham | Fitzwygram | Lee | Davidson | ||||||||||||||||||
| New Forest | F. Compton | Douglas-Scott-Montagu | H. Compton | Hobart | Perkins | ||||||||||||||||
| Petersfield | Palmer | → | Wickham | Nicholson | |||||||||||||||||
| Portsmouth | Crossman | → | Baker | Majendie | Baker | Falle | → | ||||||||||||||
| Vanderbyl | Wilson | Clough | Bramsdon | Lucas | Bramsdon | Beresford | Meux | ||||||||||||||
| Southampton | Giles | Chamberlayne | Evans | Chamberlayne | Philipps | ||||||||||||||||
| Commerell | Evans | Simeon | Ward | ||||||||||||||||||
| Winchester | Tottenham | Moss | Myers | G. V. Baring | Carnegie | → | |||||||||||||||
| Isle of Wight | Webster | Seely | → | G. Baring | Hall | ||||||||||||||||
1918 to 1950
Coalition Liberal (1918–22) / National Liberal (1922–23) Conservative Labour Liberal National Government National Liberal (1931–68) National Party
| Constituency | 1918 | 20 | 21 | 1922 | 22 | 23 | 1923 | 1924 | 1929 | 31 | 1931 | 32 | 34 | 1935 | 39 | 40 | 40 | 41 | 43 | 1945 | 45 |
|---|---|---|---|---|---|---|---|---|---|---|---|---|---|---|---|---|---|---|---|---|---|
| Aldershot | Palmer | Lyttelton | |||||||||||||||||||
| Basingstoke | Geddes | Holbrook | Fletcher | Holbrook | Wallop | Wolff | Donner | ||||||||||||||
| Bournemouth | Croft | → | Lyle | Bracken | |||||||||||||||||
| Fareham | Davidson | Inskip | White | ||||||||||||||||||
| New Forest & Christchurch | Perkins | Ashley | Mills | Crosthwaite-Eyre | |||||||||||||||||
| Petersfield | Nicholson | Dorman-Smith | Jeffreys | ||||||||||||||||||
| Portsmouth Central | Bramsdon | Privett | Bramsdon | Foster | Hall | Beaumont | Snow | ||||||||||||||
| Portsmouth North | Falle | Keyes | James | Bruce | |||||||||||||||||
| Portsmouth South | Cayzer | Wilson | Cayzer | Lucas | |||||||||||||||||
| Southampton | Philipps | Perkins | Morley | Barrie | Reith | Thomas | Morley | ||||||||||||||
| Ward | Bathurst | Lewis | Craven-Ellis | Lewis | |||||||||||||||||
| Winchester | Hennessy | Ellis | Palmer | Jeger | |||||||||||||||||
| Isle of Wight | Hall | Chatfeild-Clarke | Seely | Macdonald | |||||||||||||||||
1950 to 1983
Conservative Labour Liberal Social Democratic Speaker
| Constituency | 1950 | 1951 | 52 | 54 | 1955 | 1959 | 60 | 64 | 1964 | 65 | 1966 | 68 | 1970 | 71 | Feb 74 | Oct 74 | 77 | 1979 | 81 |
|---|---|---|---|---|---|---|---|---|---|---|---|---|---|---|---|---|---|---|---|
| Aldershot | Lyttelton | Errington | Critchley | ||||||||||||||||
| Basingstoke | Donner | Freeth | Mitchell | ||||||||||||||||
| Bournemouth East & Christchurch / Bth East (1974) | Bracken | Nicolson | Cordle | Atkinson | |||||||||||||||
| Bournemouth West | Gascoyne-Cecil | Eden | |||||||||||||||||
| Christchurch and Lymington | N/A | Adley | |||||||||||||||||
| Eastleigh | N/A | Price | |||||||||||||||||
| Gosport | N/A | Viggers | |||||||||||||||||
| Gosport and Fareham / Fareham (1974) | Bennett | Lloyd | |||||||||||||||||
| New Forest | Crosthwaite-Eyre | McNair-Wilson | |||||||||||||||||
| Petersfield | Jeffreys | Legh | Quennell | Mates | |||||||||||||||
| Portsmouth Langstone / Havant & Waterloo (1974) | Stevens | Lloyd | |||||||||||||||||
| Portsmouth South | Lucas | Pink | |||||||||||||||||
| Portsmouth West / Portsmouth North (1974) | Clarke | Judd | Griffiths | ||||||||||||||||
| Southampton Itchen | Morley | King | → | Mitchell | → | ||||||||||||||
| Southampton Test | King | Howard | Fletcher-Cooke | Mitchell | Hill | Gould | Hill | ||||||||||||
| Winchester | Smithers | Morgan-Giles | Browne | ||||||||||||||||
| Isle of Wight | Macdonald | Woodnutt | Ross | ||||||||||||||||
1983 to 2010
Conservative Democratic Unionist Independent Conservative Labour Liberal Liberal Democrats Social Democratic
| Constituency | 1983 | 84 | 1987 | 1992 | 94 | 1997 | 00 | 2001 | 02 | 04 | 2005 | |||||||
|---|---|---|---|---|---|---|---|---|---|---|---|---|---|---|---|---|---|---|
| Aldershot | Critchley | Howarth | ||||||||||||||||
| Basingstoke | Hunter | → | → | Miller | ||||||||||||||
| East Hampshire | Mates | |||||||||||||||||
| Eastleigh | Price | Milligan | Chidgey | Huhne | ||||||||||||||
| Fareham | Lloyd | Hoban | ||||||||||||||||
| Gosport | Viggers | |||||||||||||||||
| Havant | Lloyd | Willetts | ||||||||||||||||
| New Forest / New Forest East (1997) | McNair-Wilson | Lewis | ||||||||||||||||
| New Forest West | Swayne | |||||||||||||||||
| North East Hampshire | Arbuthnot | |||||||||||||||||
| North West Hampshire | Mitchell | Young | ||||||||||||||||
| Portsmouth North | Griffiths | Rapson | McCarthy-Fry | |||||||||||||||
| Portsmouth South | Pink | Hancock | Martin | Hancock | ||||||||||||||
| Romsey and Waterside / Romsey (1997) | Colvin | Gidley | ||||||||||||||||
| Southampton Itchen | Chope | Denham | ||||||||||||||||
| Southampton Test | Hill | Whitehead | ||||||||||||||||
| Winchester | Browne | Malone | Oaten | |||||||||||||||
| Isle of Wight | Ross | Field | Brand | Turner | ||||||||||||||
2010 to present
Conservative Independent Labour Liberal Democrats
1parts transferred in 2024 to the constituency of Farnham and Bordon which is partially in Surrey
See also
Notes
References
Wikiwand in your browser!
Seamless Wikipedia browsing. On steroids.
Every time you click a link to Wikipedia, Wiktionary or Wikiquote in your browser's search results, it will show the modern Wikiwand interface.
Wikiwand extension is a five stars, simple, with minimum permission required to keep your browsing private, safe and transparent.