Loading AI tools
Milton Keynes City Council is the local authority for the City of Milton Keynes, a unitary authority in Buckinghamshire, England. Until 1 April 1997 it was a non-metropolitan district.
Below is the full seat composition in Milton Keynes after each local election. In 1976, 1996, 2002 and 2014, the whole council was elected after boundary changes.[1][2][3][4][5] In 1991 borough boundary changes took place but the number of seats remained the same.[6][7]
| Administration in charge of council after election. | |
| Party did not exist or contest elections. |
Milton Keynes City Council (2023–Present)
Milton Keynes Council (1997 - 2023)
| Year | Seats[11] | Con | Lab | Lib Dems | UKIP | Independent | Others | ||
|---|---|---|---|---|---|---|---|---|---|
| Total | Contested | Majority | |||||||
| 1998 | 51 | 17 | 26 | 4 | 27 | 19 | 1 | ||
| 1999 | 51 | 17 | 26 | 4 | 27 | 19 | 1 | 0
Green Campaign for Disabled | |
| 2000 | 51 | 17 | 26 | 8 | 22 | 20 | 1 | 0 | |
| 2002 | 51 | 51 | 26 | 8 | 16 | 27 | 0 | 0 | 0 |
| 2003 | 51 | 17 | 26 | 7 | 16 | 27 | 0 | 1 | 0 |
| 2004 | 51 | 17 | 26 | 7 | 16 | 27 | 0 | 1 | 0 |
| 2006 | 51 | 17 | 26 | 13 | 15 | 23 | 0 | 0 | |
| 2007 | 51 | 17 | 26 | 15 | 13 | 22 | 0 | 1 | 0 |
| 2008 | 51 | 17 | 26 | 20 | 10 | 21 | 0 | 0 | |
| 2010 | 51 | 17 | 26 | 17 | 9 | 24 | 0 | 1 | |
| 2011 | 51 | 17 | 26 | 21 | 9 | 18 | 0 | 3 | 0 |
| 2012 | 51 | 17 | 26 | 20 | 16 | 15 | 0 | 0 | 0 |
| 2014[12] | 57 | 57 | 29 | 18 | 25 | 13 | 1 | 0 | |
| 2015[13] | 57 | 19 | 29 | 22 | 23 | 12 | 0 | 0 | |
| 2016[14] | 57 | 20 | 29 | 22 | 22 | 13 | 0 | 0 | 0 |
| 2018[15] | 57 | 20 | 29 | 24 | 21 | 12 | 0 | 0 | 0 |
| 2019[16] | 57 | 19 | 29 | 19 | 23 | 15 | 0 | 0 | |
| 2021[17] | 57 | 19 | 29 | 24 | 19 | 13 | 0 | 1 | |
| 2022[18] | 57 | 19 | 29 | 22 | 20 | 14 | 1 | ||
Milton Keynes Borough Council (1974 - 1997)
| Year | Seats [19][20] | Con | Lab | Lib Dems | Lib | SDP | Independent | Others | ||
|---|---|---|---|---|---|---|---|---|---|---|
| Total | Contested | Majority | ||||||||
| 1976 | 46 | 46 | 24 | 33 | 12 | 0 | 1 | |||
| 1978 | 46 | 15 | 24 | 32 | 14 | 0 | ||||
| 1979 | 46 | 16 | 24 | 31 | 15 | 0 | ||||
| 1980 | 46 | 16 | 24 | 26 | 19 | 1 | ||||
| 1982 | 46 | 16 | 24 | 22 | 17 | 6 | 1 | |||
| 1983 | 46 | 15 | 24 | 20 | 18 | 7 | 1 | 0 | ||
| 1984 | 46 | 16 | 24 | 17 or 18 | 17 or 20 | 7 or 9 | 1 or 2 | |||
| 1986 | 46 | 15 | 24 | 12 | 19 | 13 | 2 | 0 | ||
| 1987 | 46 | 15 | 24 | 11 | 18 | 14 | 3 | 0 | ||
| 1988 | 46 | 16 | 24 | 13 | 18 | 13 | 2 | 0 | ||
| 1990 | 46 | 15 | 24 | 13 | 24 | 7 | 2 | 0 | ||
| 1991 | 46 | 15 | 24 | 13 | 25 | 17 | 0 | 0 | ||
| 1992 | 46 | 16 | 24 | 15 | 21 | 9 | 1 | 0 | ||
| 1994 | 46 | 15 | 24 | 14 | 19 | 11 | 2 | 0 | ||
| 1995 | 46 | 16 | 24 | 12 | 21 | 10 | 3 | 0 | ||
| 1996 | 51 | 51 | 26 | 2 | 20 | 18 | 1 | 0 | ||
Milton Keynes District Council (1973 - 1974)
Milton Keynes within Buckinghamshire County Council (1967 - 1973)
By ward
2002 to 2012
The composition of Milton Keynes Council following each election was as follows.
| 2002 | 2003 | 2004 | 2006 | 2007 | 2008 | 2010 | 2011 | 2012 | |
|---|---|---|---|---|---|---|---|---|---|
| Bletchley & Fenny Stratford | Lab 3 | Lab 3 | Lab 3 | Lab 2/Con 1 | Con 2/Lab 1 | Con 3 | Con 3 | Con 3 | Con 2/Lab 1 |
| Bradwell | Lib 3 | Lib 3 | Lib 3 | Lib 3 | Lib 3 | Lib 3 | Lib 3 | Lib 3 | Lib 2/Lab 1 |
| Campbell Park | Lib 3 | Lib 3 | Lib 3 | Lib 3 | Lib 3 | Lib 3 | Lib 3 | Lib 3 | Lib 2/Lab 1 |
| Danesborough | Con 1 | Con 1 | Con 1 | Con 1 | Con 1 | Con 1 | Con 1 | Con 1 | Con 1 |
| Denbigh | Lab 2 | Lab 2 | Lab 2 | Lab 2 | Lab 2 | Lab 2 | Lab 2 | Lab 2 | Lab 2 |
| Eaton Manor | Lab 2 | Lab 2 | Lab 2 | Lab 2 | Lab 2 | Lab 2 | Lab 2 | Lab 2 | Lab 2 |
| Emerson Valley | Lib 3 | Lib 3 | Lib 3 | Lib 3 | Lib 3 | Lib 2/Con 1 | Lib 2/Con 1 | Con 2/Lib 1 | Con 2/Lib 1 |
| Furzton | Lib 2 | Lib 2 | Lib 2 | Lib 2 | Lib 2 | Lib 2 | Lib 2 | Lib 2 | Lib 2 |
| Hanslope | Con 1 | Con 1 | Con 1 | Con 1 | Con 1 | Con 1 | Con 1 | Con 1 | Con 1 |
| Linford North | Lib 2 | Lib 2 | Lib 2 | Lib 1/Con 1 | Lib 1/Con 1 | Lib 1/Con 1 | Lib 2 | Lib 2 | Lib 2 |
| Linford South | Lib 2 | Lib 2 | Lib 2 | Lib 1/Con 1 | Lib 1/Con 1 | Lib 1/Con 1 | Lib 2 | Lib 1/Con 1 | Lib 1/Con 1 |
| Loughton Park | Con 3 | Con 3 | Con 3 | Con 3 | Con 3 | Con 3 | Con 3 | Con 3 | Con 3 |
| Middleton | Lib 2 | Lib 2 | Lib 2 | Lib 2 | Lib 1/Con 1 | Lib 1/Con 1 | Lib 1/Con 1 | Lib 1/Con 1 | Con 2 |
| Newport Pagnell North | Lib 2 | Lib 2 | Lib 2 | Lib 2 | Lib 2 | Lib 2 | Lib 2 | Lib 2 | Lib 2 |
| Newport Pagnell South | Lib 2 | Lib 2 | Lib 2 | Lib 2 | Lib 2 | Lib 2 | Lib 2 | Lib 2 | Lib 2 |
| Olney | Lib 2 | Lib 2 | Lib 2 | Lib 1/Con 1 | Lib 1/Con 1 | Con 2 | Con 2 | Con 2 | Con 2 |
| Sherington | Lib 1 | Lib 1 | Lib 1 | Lib 1 | Lib 1 | Lib 1 | Lib 1 | Con 1 | Con 1 |
| Stantonbury | Lab 2 | Lab 2 | Lab 2 | Lab 2 | Lab 2 | Lab 1/Con 1 | Lab 1/Con 1 | Lab 1/Con 1 | Lab 2 |
| Stony Stratford | Con 3 | Con 3 | Con 3 | Con 3 | Con 3 | Con 3 | Con 3 | Con 3 | Con 3 |
| Walton Park | Lib 3 | Lib 3 | Lib 3 | Lib 2/Con 1 | Lib 2/Con 1 | Lib 2/Con 1 | Lib 3 | Lib 2/Con 1 | Con 2/Lib 1 |
| Whaddon | Lab 2 | Lab 2 | Lab 2 | Lab 2 | Lab 2 | Lab 2 | Lab 2 | Lab 2 | Lab 2 |
| Wolverton | Lab 3 | Lab 3 | Lab 3 | Lab 3 | Lab 3 | Lab 2/Lib 1 | Lab 2/Lib 1 | Lab 2/Lib 1 | Lab 3 |
| Woughton | Lab 2 | Lab 2 | Lab 2 | Lab 2 | Lab 2 | Lab 2 | Lab 2 | Lab 2 | Lab 2 |
2014 to present
In 2014 the boundaries were revised so that there were 57 seats and each ward had three seats each [see below]. Elections were held for all seats in that year, before returning to the one-third model for subsequent years.
| 2014 | 2015 | 2016 | 2018 | 2019 | 2021 | 2022 | 2023 | 2024 | |
|---|---|---|---|---|---|---|---|---|---|
| Bletchley East | Lab 2/UKIP 1 | Lab 3 | Lab 3 | Lab 3 | Lab 3 | Lab 3 | Lab 3 | Lab 3 | Lab 3 |
| Bletchley Park | Lab 2/Con 1 | Lab 2/Con 1 | Lab 2/Con 1 | Con 2/Lab 1 | Con 2/Lab 1 | Con 3 | Con 2/Lab 1 | Lab 2/Con 1 | Lab 3 |
| Bletchley West | Lab 3 | Lab 2/Con 1 | Lab 2/Con 1 | Lab 2/Con 1 | Lab 3 | Lab 2/Con 1 | Lab 2/Con 1 | Lab 2/Con 1 | Lab 3 |
| Bradwell | Lab 2/Lib 1 | Lib 2/Lab 1 | Lib 3 | Lib 3 | Lib 3 | Lib 3 | Lib 3 | Lib 3 | Lib 3 |
| Broughton | Con 2/Lib 1 | Con 2/Lib 1 | Con 2/Lib 1 | Con 2/Lib 1 | Lib 2/Con 1 | Lib 3 | Lib 3 | Lib 3 | Lib 3 |
| Campbell Park & Old Woughton | Lib 2/Con 1 | Lib 2/Con 1 | Lib 2/Con 1 | Con 2/Lib 1 | Lib 2/Con 1 | Con 2/Lib 1 | Lib 2/Con 1 | Lib 2/Con 1 | Lib 3 |
| Central Milton Keynes | Lab 3 | Lab 3 | Lab 3 | Lab 3 | Lab 3 | Lab 3 | Lab 3 | Lab 3 | Lab 3 |
| Danesborough & Walton | Con 3 | Con 3 | Con 3 | Con 3 | Con 3 | Con 3 | Con 3 | Con 2/Lab 1 | Con 2/Lab 1 |
| Loughton & Shenley | Lab 2/Con 1 | Lab 2/Con 1 | Lab 2/Con 1 | Con 2/Lab 1 | Con 2/Lab 1 | Con 2/Lab 1 | Lab 2/Con 1 | Lab 3 | Lab 3 |
| Monkston | Lib 3 | Lib 2/Con 1 | Lib 2/Con 1 | Lib 2/Con 1 | Lib 3 | Lib 3 | Lib 3 | Lib 3 | Lib 3 |
| Newport Pagnell North & Hanslope | Con 3 | Con 3 | Con 3 | Con 3 | Con 3 | Con 3 | Con 3 | Con 3 | Con 3 |
| Newport Pagnell South | Lib 3 | Lib 3 | Lib 3 | Lib 3 | Lib 3 | Lib 2/Con 1 | Lib 2/Con 1 | Lib 2/Con 1 | Lib 2/Con 1 |
| Olney | Con 3 | Con 3 | Con 3 | Con 3 | Con 3 | Con 3 | Con 3 | Con 2/Lab 1 | Con 2/Lab 1 |
| Shenley Brook End | Lib 3 | Lib 2/Con 1 | Lib 2/Con 1 | Lib 2/Con 1 | Lib 2/Con 1 | Con 2/Lib 1 | Con 2/Lib 1 | Lib 2/Con 1 | Lib 3 |
| Stantonbury | Lab 3 | Lab 2/Con 1 | Lab 2/Con 1 | Lab 2/Con 1 | Lab 2/Con 1 | Con 2/Lab 1 | Con 2/Lab 1 | Lab 2/Con 1 | Lab 3 |
| Stony Stratford | Lab 2/Con 1 | Lab 2/Con 1 | Lab 2/Con 1 | Lab 2/Con 1 | Lab 3 | Lab 2/Con 1 | Lab 2/Con 1 | Lab 2/Con 1 | Lab 2/Con 1 |
| Tattenhoe | Con 3 | Con 3 | Con 3 | Con 2/Lab 1 | Con 2/Lab 1 | Con 2/Lab 1 | Con 3 | Con 3 | Con 3 |
| Wolverton | Lab 3 | Lab 3 | Lab 3 | Lab 3 | Lab 3 | Lab 3 | Lab 3 | Lab 3 | Lab 3 |
| Woughton & Fishermead | Lab 3 | Lab 3 | Lab 3 | Lab 3 | Lab 3 | Lab 3 | Lab 3 | Lab 3 | Lab 3 |
 2002 results map
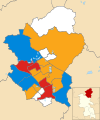 2003 results map
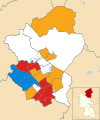 2004 results map
 2006 results map
 2007 results map
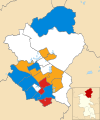 2008 results map
 2010 results map
 2011 results map
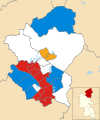 2012 results map
 2014 results map
 2015 results map
 2016 results map
 2018 results map
 2019 results map
 2021 results map
 2022 results map
 2023 results map
 2024 results map


One third of the council is elected each year for 3 years, followed by one year without election, unless there is a substantial boundary change (when all seats are elected). Following an electoral review, changes to wards and an increase in the number of seats, 57 councillors were elected for all 19 wards from May 2014 onwards.[22] After the previous reorganisation in 2002, 51 councillors were elected from 23 wards.[23]
1973
The first elections to the newly created Milton Keynes Borough Council took place on 7 June 1973 There were 40 seats up for election spread over 16 Wards. All councillors were elected for three years
1976
In November 1975, the Boundary Commission proposed new ward boundaries.[24] (These wards are generally larger than the civil parishes that give them their names. Some parishes are divided between wards. For details, see the Boundary Commission report.)
- Bletchley Central
- Danesborough
- Denbigh
- Eaton
- Loughton
- Newport Rural
- Newport Urban
- Newton
- Petsoe Manor
- Pineham
- Sherington
- Stantonbury
- Stony Stratford
- Watling
- Whaddon
- Wolverton
1996 to 2000
Between 1996 and 2000, there were 51 seats up for election. Boundary changes were made before the 2002 election but this did not affect the number of seats up for election.
2002 to 2012
.svg)
From 2002 until the 2014 local elections, there were 23 wards in the Borough, which were represented by 51 councillors. The councillors corresponded to the wards in the following way:
- There were 8 wards that represented by 3 councillors:
- There were 12 wards that represented by 2 councillors:
- Denbigh
- Eaton Manor
- Furzton
- Linford North
- Linford South
- Middleton
- Newport Pagnell North
- Newport Pagnell South
- Olney
- Stantonbury
- Whaddon
- Woughton
- There were 3 wards that represented by 1 councillor:
2014 onwards
.svg)
Following an electoral review and with effect from the 2014 Milton Keynes Council election in May 2014, there were 57 Councillors representing 19 wards, each with having 3 councillors.[25]
These wards are as follows:[26]
- Bletchley East
- Bletchley Park
- Bletchley West
- Bradwell
- Broughton
- Campbell Park & Old Woughton
- Central Milton Keynes
- Danesborough & Walton
- Loughton & Shenley
- Monkston
- Newport Pagnell North & Hanslope
- Newport Pagnell South
- Olney
- Shenley Brook End
- Stantonbury
- Stony Stratford
- Tattenhoe
- Wolverton
- Woughton & Fishermead
2002-2006
| Party | Candidate | Votes | % | ±% | |
|---|---|---|---|---|---|
| Labour | 1,066 | 50.0 | +5.5 | ||
| Conservative | 776 | 36.4 | −2.5 | ||
| Liberal Democrats | 191 | 9.0 | −7.7 | ||
| UKIP | 99 | 4.6 | +4.6 | ||
| Majority | 290 | 13.6 | |||
| Turnout | 2,132 | ||||
| Labour hold | Swing | ||||
2006-2010
| Party | Candidate | Votes | % | ±% | |
|---|---|---|---|---|---|
| Labour | Camilla Turnbull | 1,108 | 43.8 | +0.9 | |
| Conservative | Sam McCleod | 914 | 36.1 | −1.4 | |
| England First | Anna Seymour | 221 | 8.7 | +8.7 | |
| Liberal Democrats | Alfred Vella | 129 | 5.1 | −3.3 | |
| UKIP | Micheal Maylam | 109 | 4.3 | −3.4 | |
| Independent | Sam Browne | 49 | 1.9 | +1.9 | |
| Majority | 194 | 7.7 | |||
| Turnout | 2,530 | ||||
| Labour hold | Swing | ||||
2010-2014
| Party | Candidate | Votes | % | ±% | |
|---|---|---|---|---|---|
| Labour | Mohammed Khan | 1,356 | 39.9 | +3.1 | |
| UKIP | Vince Peddle | 855 | 25.2 | +14.3 | |
| Conservative | John Bailey | 779 | 22.9 | −12.6 | |
| Green | Keith Allen | 277 | 8.2 | −4.0 | |
| Liberal Democrats | Rosemary Snell | 128 | 3.8 | −0.9 | |
| Majority | 501 | 14.8 | |||
| Turnout | 3,395 | ||||
| Labour hold | Swing | ||||
2014-2018
| Party | Candidate | Votes | % | ±% | |
|---|---|---|---|---|---|
| Conservative | Bill Green | 1,604 | 53.0 | +5.2 | |
| Labour | Nick Phillips | 749 | 24.8 | +4.0 | |
| Liberal Democrats | Jane Carr | 672 | 22.2 | +3.6 | |
| Majority | 855 | 28.3 | |||
| Turnout | 3,025 | ||||
| Conservative hold | Swing | ||||
2018-2022
| Party | Candidate | Votes | % | ±% | |
|---|---|---|---|---|---|
| Labour | Emily Darlington | 1,355 | 50.9 | +3.1 | |
| Conservative | Angela Kennedy | 1,026 | 38.5 | −0.7 | |
| Green | Jo Breen | 131 | 4.9 | −3.1 | |
| UKIP | Vince Peddle | 101 | 3.8 | +3.8 | |
| Liberal Democrats | Richard Greenwood | 50 | 1.9 | −3.1 | |
| Majority | 329 | 12.4 | |||
| Turnout | 2,663 | ||||
| Labour hold | Swing | ||||
2022-2026
| Party | Candidate | Votes | % | ±% | |
|---|---|---|---|---|---|
| Labour | Susan Smith | 1,355 | 73.3 | +3.4 | |
| Conservative | Rafal Brewczynski | 340 | 18.4 | −1.8 | |
| Liberal Democrats | Raissa Roy | 154 | 8.3 | −1.6 | |
| Majority | 1,015 | 54.9 | |||
| Turnout | 1,849 | ||||
| Labour hold | Swing | ||||
| Party | Candidate | Votes | % | ±% | |
|---|---|---|---|---|---|
| Liberal Democrats | Tony Oyakhire | 1,088 | 43.5 | −2.6 | |
| Labour | Saskia Soden | 684 | 27.4 | +11.5 | |
| Conservative | Ade Adeliyi | 561 | 22.4 | −11.9 | |
| Green | Gary Lloyd | 80 | 3.2 | +3.2 | |
| Independent | Lynn Cocksedge | 53 | 2.1 | +2.1 | |
| Women's Equality | Jane Whild | 34 | 1.4 | +1.4 | |
| Majority | 404 | 16.2 | |||
| Turnout | 2,500 | ||||
| Liberal Democrats gain from Conservative | Swing | ||||
Wikiwand in your browser!
Seamless Wikipedia browsing. On steroids.
Every time you click a link to Wikipedia, Wiktionary or Wikiquote in your browser's search results, it will show the modern Wikiwand interface.
Wikiwand extension is a five stars, simple, with minimum permission required to keep your browsing private, safe and transparent.