Folkestone and Hythe District Council is the local authority for the Folkestone and Hythe District in Kent, England. The district was called Shepway prior to 2018. The council is elected every four years. Since the last boundary changes in 2015, 30 councillors have been elected from 13 wards.[1]
Council elections
- 1973 Shepway District Council election
- 1976 Shepway District Council election
- 1979 Shepway District Council election (New ward boundaries)[2]
- 1983 Shepway District Council election
- 1987 Shepway District Council election (District boundary changes took place but the number of seats remained the same)[3][4]
- 1991 Shepway District Council election
- 1995 Shepway District Council election
- 1999 Shepway District Council election
- 2003 Shepway District Council election (New ward boundaries reduced the number of seats by 10)[5][6]
- 2007 Shepway District Council election
- 2011 Shepway District Council election
- 2015 Shepway District Council election (New ward boundaries)[7]
- 2019 Folkestone and Hythe District Council election
- 2023 Folkestone and Hythe District Council election
Results maps
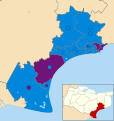 2015 results map
 2019 results map
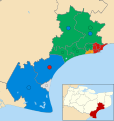 2023 results map


By-election results
1995-1999
| Party | Candidate | Votes | % | ±% | |
|---|---|---|---|---|---|
| Labour | 593 | 47.9 | |||
| Conservative | 429 | 34.7 | |||
| Liberal Democrats | 215 | 17.4 | |||
| Majority | 164 | 13.2 | |||
| Turnout | 1,237 | 54.8 | |||
| Labour hold | Swing | ||||
| Party | Candidate | Votes | % | ±% | |
|---|---|---|---|---|---|
| Labour | 278 | 42.2 | +12.2 | ||
| Conservative | 222 | 33.7 | +5.1 | ||
| Liberal Democrats | 158 | 24.0 | −17.1 | ||
| Majority | 56 | 8.5 | |||
| Turnout | 658 | 20.8 | |||
| Labour gain from Liberal Democrats | Swing | ||||
1999-2003
| Party | Candidate | Votes | % | ±% | |
|---|---|---|---|---|---|
| Liberal Democrats | 387 | 43.0 | +8.2 | ||
| Labour | 273 | 30.4 | −14.3 | ||
| Conservative | 239 | 26.6 | +6.1 | ||
| Majority | 114 | 12.6 | |||
| Turnout | 899 | 26.5 | |||
| Liberal Democrats gain from Labour | Swing | ||||
| Party | Candidate | Votes | % | ±% | |
|---|---|---|---|---|---|
| Conservative | 480 | 51.9 | −12.6 | ||
| Liberal Democrats | 369 | 39.9 | +17.0 | ||
| Labour | 75 | 8.1 | −4.5 | ||
| Majority | 111 | 12.0 | |||
| Turnout | 924 | 38.6 | |||
| Conservative hold | Swing | ||||
| Party | Candidate | Votes | % | ±% | |
|---|---|---|---|---|---|
| Liberal Democrats | Gary George | 424 | 36.3 | +0.5 | |
| Conservative | Dick Pascoe | 407 | 34.8 | +4.0 | |
| Labour | 339 | 29.0 | −4.5 | ||
| Majority | 17 | 1.5 | |||
| Turnout | 1,170 | 32.7 | |||
| Liberal Democrats gain from Labour | Swing | ||||
| Party | Candidate | Votes | % | ±% | |
|---|---|---|---|---|---|
| Liberal Democrats | Peter Smith | 598 | 57.0 | +57.0 | |
| Conservative | 451 | 43.0 | −27.8 | ||
| Majority | 147 | 14.0 | |||
| Turnout | 1,049 | 34.7 | |||
| Liberal Democrats gain from Conservative | Swing | ||||
| Party | Candidate | Votes | % | ±% | |
|---|---|---|---|---|---|
| Conservative | Hugh Barker | 358 | 61.5 | +25.7 | |
| Labour | 224 | 38.5 | +0.7 | ||
| Majority | 134 | 23.0 | |||
| Turnout | 582 | 19.6 | |||
| Conservative hold | Swing | ||||
| Party | Candidate | Votes | % | ±% | |
|---|---|---|---|---|---|
| Liberal Democrats | 1,003 | 58.3 | +14.8 | ||
| Conservative | Edwina Boyt | 653 | 37.9 | −5.6 | |
| Labour | 65 | 3.8 | −9.3 | ||
| Majority | 350 | 20.4 | |||
| Turnout | 1,721 | 36.1 | |||
| Liberal Democrats hold | Swing | ||||
| Party | Candidate | Votes | % | ±% | |
|---|---|---|---|---|---|
| Liberal Democrats | Julie White | 401 | 37.4 | +17.4 | |
| Conservative | 365 | 34.0 | −1.6 | ||
| Labour | 262 | 24.4 | +0.0 | ||
| UKIP | 44 | 4.1 | +4.1 | ||
| Majority | 36 | 3.4 | |||
| Turnout | 1,072 | 46.5 | |||
| Liberal Democrats gain from Labour | Swing | ||||
2003-2007
| Party | Candidate | Votes | % | ±% | |
|---|---|---|---|---|---|
| Liberal Democrats | Ann Birchmore | 550 | 48.1 | +15.4 | |
| Conservative | Derek Morgan | 502 | 43.9 | −9.5 | |
| Labour | Albert Ryder | 91 | 8.0 | −5.9 | |
| Majority | 48 | 4.2 | |||
| Turnout | 1,143 | 41.8 | |||
| Liberal Democrats gain from Conservative | Swing | ||||
| Party | Candidate | Votes | % | ±% | |
|---|---|---|---|---|---|
| Conservative | Simon Ashworth | 349 | 50.6 | −5.6 | |
| Liberal Democrats | Sylvia Oiller | 273 | 39.6 | +15.3 | |
| Labour | Adrian Cirket | 68 | 9.9 | −9.6 | |
| Majority | 76 | 11.0 | |||
| Turnout | 690 | 40.7 | |||
| Conservative hold | Swing | ||||
| Party | Candidate | Votes | % | ±% | |
|---|---|---|---|---|---|
| Conservative | 575 | 52.5 | +33.9 | ||
| Liberal Democrats | 352 | 32.1 | −30.9 | ||
| Labour | 169 | 15.4 | −3.0 | ||
| Majority | 223 | 20.4 | |||
| Turnout | 1,096 | 37.0 | |||
| Conservative gain from Liberal Democrats | Swing | ||||
| Party | Candidate | Votes | % | ±% | |
|---|---|---|---|---|---|
| Conservative | David Stephenson | 560 | 66.2 | +19.0 | |
| Labour | 175 | 20.7 | −18.1 | ||
| Liberal Democrats | 111 | 13.1 | −0.8 | ||
| Majority | 385 | 45.5 | |||
| Turnout | 846 | 33.5 | |||
| Conservative gain from Labour | Swing | ||||
| Party | Candidate | Votes | % | ±% | |
|---|---|---|---|---|---|
| Conservative | Philip Martin | 409 | 53.4 | +16.7 | |
| Labour | 237 | 30.9 | +8.5 | ||
| Liberal Democrats | 120 | 15.7 | −21.8 | ||
| Majority | 172 | 22.5 | |||
| Turnout | 766 | 23.7 | |||
| Conservative gain from Green | Swing | ||||
2007-2011
| Party | Candidate | Votes | % | ±% | |
|---|---|---|---|---|---|
| Liberal Democrats | Neil Matthews | 589 | 39.6 | +22.1 | |
| Conservative | Paul Peacock | 483 | 32.5 | −26.4 | |
| UKIP | Barbara Johnson | 255 | 17.2 | +5.9 | |
| BNP | Harry Williams | 94 | 6.3 | +6.3 | |
| Shepway Independents | Colin Tearle | 65 | 4.4 | +4.4 | |
| Majority | 106 | 7.1 | |||
| Turnout | 1,486 | 46.1 | |||
| Liberal Democrats gain from Conservative | Swing | ||||
| Party | Candidate | Votes | % | ±% | |
|---|---|---|---|---|---|
| Conservative | Toby Clifton-Holt | 430 | 58.7 | −10.3 | |
| Shepway Independents | Graham Snell | 121 | 16.5 | +16.5 | |
| Liberal Democrats | Sally Matthews | 114 | 15.6 | −0.9 | |
| Labour | Douglas Suckling | 68 | 9.3 | −5.3 | |
| Majority | 309 | 42.2 | |||
| Turnout | 733 | 41.0 | |||
| Conservative hold | Swing | ||||
| Party | Candidate | Votes | % | ±% | |
|---|---|---|---|---|---|
| Conservative | Shane Lawrence | 452 | 51.4 | +2.2 | |
| Liberal Democrats | Brian Wright | 333 | 37.9 | −12.9 | |
| UKIP | Wendy Nevard | 94 | 10.7 | +10.7 | |
| Majority | 119 | 13.5 | |||
| Turnout | 879 | 30.7 | |||
| Conservative hold | Swing | ||||
| Party | Candidate | Votes | % | ±% | |
|---|---|---|---|---|---|
| Conservative | Tony Hills | 591 | 49.3 | −0.8 | |
| Labour | Donald Russell | 247 | 20.6 | +20.6 | |
| Liberal Democrats | Ted Last | 184 | 15.3 | −7.7 | |
| Independent | Rochelle Saunders | 177 | 14.8 | +14.8 | |
| Majority | 344 | 28.7 | |||
| Turnout | 1,199 | ||||
| Conservative hold | Swing | ||||
2011-2015
| Party | Candidate | Votes | % | ±% | |
|---|---|---|---|---|---|
| Liberal Democrats | Lynne Beaumont | 461 | 36.2 | +12.2 | |
| Conservative | Leo Griggs | 320 | 25.1 | −15.7 | |
| People First Party | Patricia Copping | 200 | 15.7 | +1.5 | |
| UKIP | Hod Birkby | 153 | 12.0 | +2.8 | |
| Labour | Nicola Keen | 111 | 8.7 | +8.7 | |
| Green | Derek Moran | 29 | 2.3 | +2.3 | |
| Majority | 141 | 11.1 | |||
| Turnout | 1,274 | ||||
| Liberal Democrats gain from Conservative | Swing | ||||
| Party | Candidate | Votes | % | ±% | |
|---|---|---|---|---|---|
| UKIP | David Callahan | 287 | 27.9 | +27.9 | |
| Conservative | Rodica Wheeler | 224 | 21.7 | −17.4 | |
| Liberal Democrats | Tom McNeice | 198 | 19.2 | +2.3 | |
| Labour | Wendy Mitchell | 196 | 19.0 | −9.1 | |
| Green | David Horton | 96 | 9.3 | +9.3 | |
| TUSC | Seth Cruse | 29 | 2.8 | +2.8 | |
| Majority | 63 | 6.1 | |||
| Turnout | 1,030 | ||||
| UKIP gain from Conservative | Swing | ||||
| Party | Candidate | Votes | % | ±% | |
|---|---|---|---|---|---|
| Conservative | Helen Barker | 385 | 36.4 | −18.8 | |
| UKIP | Stephen Jardine | 293 | 27.7 | +27.7 | |
| Liberal Democrats | Hugh Robertson-Ritchie | 262 | 24.8 | +3.4 | |
| Green | Jasmine Heywood | 61 | 5.8 | +5.8 | |
| Labour | Nicola Keen | 57 | 5.4 | −18.0 | |
| Majority | 92 | 8.7 | |||
| Turnout | 1,058 | ||||
| Conservative hold | Swing | ||||
2015-2019
| Party | Candidate | Votes | % | ±% | |
|---|---|---|---|---|---|
| Conservative | Russell Tillson | 566 | 35.4 | +6.4 | |
| Labour | John Cramp | 523 | 32.7 | +21.7 | |
| Independent | David Wimble | 431 | 27.0 | +27.0 | |
| Liberal Democrats | Val Loseby | 77 | 4.8 | −3.7 | |
| Majority | 43 | 2.7 | |||
| Turnout | 1,597 | ||||
| Conservative hold | Swing | ||||
2023-2027
| Party | Candidate | Votes | % | ±% | |
|---|---|---|---|---|---|
| Conservative | Tony Hills | 375 | 24.2 | −7.4 | |
| Green | Malcolm Watkinson | 332 | 21.4 | +3.9 | |
| Labour | Chrissie Cooper | 295 | 19.0 | −4.5 | |
| Reform UK | Kim Wye | 237 | 15.3 | +15.3 | |
| Independent | Paul Peacock | 155 | 10.0 | +10.0 | |
| Independent | Dave Evans | 62 | 4.0 | +4.0 | |
| Independent | Ian Meyers | 51 | 3.3 | −18.8 | |
| No description | Dougie Young | 31 | 2.0 | −0.9 | |
| Liberal Democrats | Matt Horrox | 11 | 0.7 | −7.2 | |
| Majority | 43 | 2.8 | |||
| Turnout | 1,555 | 26.5 | −7.9 | ||
| Conservative hold | Swing | ||||
References
Wikiwand in your browser!
Seamless Wikipedia browsing. On steroids.
Every time you click a link to Wikipedia, Wiktionary or Wikiquote in your browser's search results, it will show the modern Wikiwand interface.
Wikiwand extension is a five stars, simple, with minimum permission required to keep your browsing private, safe and transparent.