Top Qs
Timeline
Chat
Perspective
Connecticut's 1st congressional district
U.S. House district for Connecticut From Wikipedia, the free encyclopedia

Remove ads
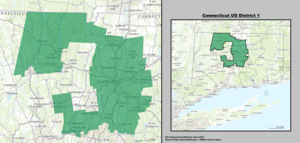
Connecticut's 1st congressional district is a congressional district in the U.S. state of Connecticut. Located in the north-central part of the state, the district is anchored by the state capital of Hartford. It encompasses much of central Connecticut and includes towns within Hartford, Litchfield, and Middlesex counties.
Quick facts Representative, Area ...
| Connecticut's 1st congressional district | |
|---|---|
.svg)  Interactive map of district boundaries since January 3, 2023 | |
| Representative | |
| Area | 673 sq mi (1,740 km2) |
| Distribution |
|
| Population (2024) | 734,950 |
| Median household income | $85,466[1] |
| Ethnicity |
|
| Cook PVI | D+12[2] |
Close
Principal cities include: Bristol, Hartford, and Torrington. The district has been represented by Democrat John B. Larson since 1999.
Remove ads
Composition
For the 118th and successive Congresses (based on redistricting following the 2020 census), Connecticut's 1st district contains portions of four planning regions and 27 municipalities.[3]
- Berlin, Bloomfield, East Granby, East Hartford, East Windsor, Glastonbury (part; also 2nd; includes Glastonbury Center), Granby, Hartford, Manchester, Newington, Rocky Hill, South Windsor, Southington, West Hartford, Wethersfield, Windsor, Windsor Locks
Lower Connecticut River Valley Planning Region (3)
- Cromwell, Middletown (part; also 3rd), Portland
Naugatuck Valley Planning Region (1)
Northwest Hills Planning Region (6)
- Barkhamsted, Colebrook, Hartland, New Hartford, Torrington (part; also 5th), Winchester
Voter registration
More information Voter Registration and Party Enrollment as of October 30, 2012, Party ...
| Voter Registration and Party Enrollment as of October 30, 2012[4] | |||||
|---|---|---|---|---|---|
| Party | Active Voters | Inactive Voters | Total Voters | Percentage | |
| Democratic | 156,784 | 11,392 | 168,176 | 40.39% | |
| Republican | 71,932 | 3,348 | 75,280 | 18.08% | |
| Minor Parties | 301 | 29 | 330 | 0.07% | |
| Unaffiliated | 161,327 | 11,299 | 172,626 | 41.46% | |
| Total | 390,334 | 26,068 | 416,412 | 100% | |
Close
Remove ads
Recent election results from statewide races
More information Year, Office ...
| Year | Office | Results[5][6][7][8][9][10][11][12] |
|---|---|---|
| 2008 | President | Obama 66% - 33% |
| 2010 | Senate | Blumenthal 60% - 39% |
| Governor | Malloy 54% - 44% | |
| 2012 | President | Obama 64% - 36% |
| Senate | Murphy 61% - 39% | |
| 2014 | Governor | Malloy 54% - 43% |
| 2016 | President | Clinton 59% - 36% |
| Senate | Blumenthal 68% - 30% | |
| 2018 | Senate | Murphy 63% - 36% |
| Governor | Lamont 53% - 41% | |
| Attorney General | Tong 56% - 43% | |
| 2020 | President | Biden 63% - 35% |
| 2022 | Senate | Blumenthal 63% - 37% |
| Governor | Lamont 61% - 38% | |
| Attorney General | Tong 63% - 36% | |
| Secretary of the State | Thomas 60% - 37% | |
| Treasurer | Russell 58% - 39% | |
| Comptroller | Scanlon 60% - 40% | |
| 2024 | President | Harris 61% - 38% |
| Senate | Murphy 62% - 36% |
Close
Remove ads
Recent elections
Summarize
Perspective
The district has the lowest Republican voter performance of the five Connecticut house seats. It has been in Democratic hands without interruption since 1957, and for all but six years since 1931.
More information Party, Candidate ...
| Party | Candidate | Votes | % | ±% | |
|---|---|---|---|---|---|
| Democratic | Barbara B. Kennelly (inc.) | 176,463 | 77% | ||
| Republican | Mario Robles, Jr. | 51,985 | 23% | ||
| Democratic hold | Swing | ||||
| Turnout | 228,448 | 100% | |||
Close
More information Party, Candidate ...
| Party | Candidate | Votes | % | ±% | |
|---|---|---|---|---|---|
| Democratic | Barbara B. Kennelly (inc.) | 126,566 | 71% | ||
| Republican | James P. Garvey | 50,690 | 29% | ||
| Democratic hold | Swing | ||||
| Turnout | 177,256 | 100% | |||
Close
More information Party, Candidate ...
| Party | Candidate | Votes | % | ±% | |
|---|---|---|---|---|---|
| Democratic | Barbara B. Kennelly (inc.) | 164,735 | 67% | ||
| Republican | Phillip Steele | 75,113 | 31% | ||
| Concerned Citizens | Gary Garneau | 5,577 | 2% | ||
| Democratic hold | Swing | ||||
| Turnout | 245,425 | 100% | |||
Close
More information Party, Candidate ...
| Party | Candidate | Votes | % | ±% | |
|---|---|---|---|---|---|
| Democratic | Barbara B. Kennelly (inc.) | 139,637 | 74% | ||
| Republican | Douglas T. Putnam | 46,865 | 24% | ||
| Concerned Citizens | John F. Forry, III | 3,405 | 2% | ||
| Democratic hold | Swing | ||||
| Turnout | 188,907 | 100% | |||
Close
More information Party, Candidate ...
| Party | Candidate | Votes | % | ±% | |
|---|---|---|---|---|---|
| Democratic | Barbara B. Kennelly (inc.) | 158,222 | 74% | ||
| Republican | Kent Sleath | 53,666 | 24% | ||
| Concerned Citizens | John F. Forry, III | 2,099 | 1% | ||
| Natural Law | Daniel A. Wasielewski | 1,149 | 1% | ||
| Democratic hold | Swing | ||||
| Turnout | 215,136 | 100% | |||
Close
More information Party, Candidate ...
| Party | Candidate | Votes | % | ±% | |
|---|---|---|---|---|---|
| Democratic | John B. Larson | 97,681 | 58% | ||
| Republican | Kevin O'Connor | 69,668 | 41% | ||
| Term Limits | Jay E. Palmieri, IV | 915 | 1% | ||
| Democratic hold | Swing | ||||
| Turnout | 168,264 | 100% | |||
Close
More information Party, Candidate ...
| Party | Candidate | Votes | % | ±% | |
|---|---|---|---|---|---|
| Democratic | John B. Larson (inc.) | 151,932 | 72% | ||
| Republican | Robert Backlund | 59,331 | 28% | ||
| Democratic hold | Swing | ||||
| Turnout | 211,263 | 100% | |||
Close
More information Party, Candidate ...
| Party | Candidate | Votes | % | ±% | |
|---|---|---|---|---|---|
| Democratic | John B. Larson (inc.) | 134,698 | 67% | ||
| Republican | Phil Steele | 66,968 | 33% | ||
| Democratic hold | Swing | ||||
| Turnout | 201,666 | 100% | |||
Close
More information Party, Candidate ...
| Party | Candidate | Votes | % | ±% | |
|---|---|---|---|---|---|
| Democratic | John B. Larson (inc.) | 197,964 | 73% | ||
| Republican | John Halstead | 73,272 | 27% | ||
| Democratic hold | Swing | ||||
| Turnout | 271,237 | 100% | |||
Close
More information Party, Candidate ...
| Party | Candidate | Votes | % | ±% | |
|---|---|---|---|---|---|
| Democratic | John B. Larson (inc.) | 154,539 | 74% | ||
| Republican | Scott MacLean | 53,010 | 26% | ||
| Democratic hold | Swing | ||||
| Turnout | 207,549 | 100% | |||
Close
More information Party, Candidate ...
| Party | Candidate | Votes | % | ±% | |
|---|---|---|---|---|---|
| Democratic | John B. Larson (inc.) | 211,563 | 72% | ||
| Republican | Joe Visconti | 76,851 | 26% | ||
| Green | Stephen Fournier | 7,199 | 2% | ||
| Democratic hold | Swing | ||||
| Turnout | 295,613 | 100% | |||
Close
More information Party, Candidate ...
| Party | Candidate | Votes | % | ±% | |
|---|---|---|---|---|---|
| Democratic | John B. Larson (inc.) | 138,440 | 61% | ||
| Republican | Ann Brickley | 84,076 | 37% | ||
| Green | Kenneth J. Krayeske | 2,564 | 1% | ||
| Socialist Action | Christopher Hutchinson | 955 | 0.42% | ||
| Democratic hold | Swing | ||||
| Turnout | 226,035 | 100% | |||
Close
More information Party, Candidate ...
| Party | Candidate | Votes | % | ±% | |
|---|---|---|---|---|---|
| Democratic | John B. Larson (inc.) | 206,575 | 70% | ||
| Republican | John Henry Decker | 82,262 | 28% | ||
| Green | Michael DeRosa | 5,746 | 2% | ||
| Democratic hold | Swing | ||||
| Turnout | 294,583 | 100% | |||
Close
More information Party, Candidate ...
| Party | Candidate | Votes | % | ±% | |
|---|---|---|---|---|---|
| Democratic | John B. Larson (inc.) | 135,825 | 62% | ||
| Republican | Matthew Corey | 78,609 | 36% | ||
| Green | Jeff Russell | 3,447 | 2% | ||
| Democratic hold | Swing | ||||
| Turnout | 217,881 | 100% | |||
Close
More information Party, Candidate ...
| Party | Candidate | Votes | % | ±% | |
|---|---|---|---|---|---|
| Democratic | John B. Larson (inc.) | 188,286 | 64% | ||
| Republican | Matthew Corey | 100,976 | 34% | ||
| Green | Mike De Rosa | 6,031 | 2% | ||
| Democratic hold | Swing | ||||
| Turnout | 295,293 | 100% | |||
Close
More information Party, Candidate ...
| Party | Candidate | Votes | % | ±% | |
|---|---|---|---|---|---|
| Democratic | John B. Larson (inc.) | 175,087 | 63% | ||
| Republican | Jennifer Nye | 96,024 | 35% | ||
| Green | Tom McCormick | 3,029 | 1% | ||
| Democratic hold | Swing | ||||
| Turnout | 274,140 | 100% | |||
Close
More information Party, Candidate ...
| Party | Candidate | Votes | % | |
|---|---|---|---|---|
| Democratic | John B. Larson (inc.) | 222,668 | 64% | |
| Republican | Mary Fay | 122,111 | 35% | |
| Green | Tom McCormick | 4,458 | 1% | |
| Total votes | 349,237 | 100% | ||
| Democratic hold | ||||
Close
More information Party, Candidate ...
| Party | Candidate | Votes | % | |
|---|---|---|---|---|
| Democratic | John Larson (inc.) | 149,556 | 61% | |
| Republican | Larry Lazor | 91,506 | 37% | |
| Green | Mary Sanders | 2,851 | 1% | |
| Total votes | 243,913 | 100% | ||
| Democratic hold | ||||
Close
More information Party, Candidate ...
| Party | Candidate | Votes | % | |
|---|---|---|---|---|
| Democratic | John Larson (inc.) | 208,649 | 63.1% | |
| Republican | Jim Griffin | 115,065 | 34.8% | |
| Green | Mary Sanders | 6,768 | 2% | |
| Total votes | 330,482 | 100% | ||
| Democratic hold | ||||
Close
Remove ads
List of members representing the district
More information Member, Party ...


.jpg)
.jpg)
.jpg)


.jpg)
.jpg)


.jpg)

.jpg)


.jpg)


Close
Remove ads
References
Wikiwand - on
Seamless Wikipedia browsing. On steroids.
Remove ads
Remove ads