Top Qs
Timeline
Chat
Perspective
Demographics of Bosnia and Herzegovina
From Wikipedia, the free encyclopedia

Remove ads
Demographic features of the population of Bosnia and Herzegovina include population density, ethnicity, education level, health of the populace, economic status, religious affiliations and other aspects of the population.

Remove ads
Vital statistics
Summarize
Perspective
[1] Source: Agency for Statistics of Bosnia and Herzegovina[2]
*No data for the period 1992–1995
Current vital statistics
Structure of the population
Population by Sex and Age Group (Census 30.IX.2013):[4]
Vital statistics by entity
Federation of Bosnia and Herzegovina
Source: Institute for Statistics of the Federation of Bosnia and Herzegovina[7]
Current vital statistics
Republika Srpska
Source: Republika Srpska Institute of Statistics[18]
Current vital statistics
Brčko District
Source: Agency for Statistics of Bosnia and Herzegovina - Statistics of the Brčko District BiH[27]
Current vital statistics
Marriages and divorces
Federation of Bosnia and Herzegovina
Republika Srpska
Brčko District
Life expectancy at birth in Bosnia and Herzegovina


Remove ads
Ethnic groups
Summarize
Perspective
According to data from the 2013 census published by the Agency for Statistics of Bosnia and Herzegovina, Bosniaks constitute 50.11% of the population, Bosnian Serbs 30.78%, Bosnian Croats 15.43%, and others form 2.73%, with the remaining respondents not declaring their ethnicity or not answering.[39]
The census results are contested by the Republika Srpska statistical office and by Bosnian Serb politicians,[40] who oppose the inclusion of non-permanent Bosnian residents in the figures.[41]
The European Union's statistics office, Eurostat, determined that the methodology used by the Bosnian statistical agency was in line with international recommendations.[42]
In Bosnia and Herzegovina, religion is often linked to ethnicity, i.e. (with the exception of agnostics and atheists) most Bosniaks are Muslim, Serbs are Orthodox Christian, and Croats are Roman Catholic.
 Ethnic structure of Bosnia and Herzegovina by municipalities in 2013
 Ethnic structure of Bosnia and Herzegovina by municipalities in 2013
 Share of Bosniaks in Bosnia and Herzegovina by municipalities in 2013
 Share of Serbs in Bosnia and Herzegovina by municipalities in 2013
 Share of Croats in Bosnia and Herzegovina by municipalities in 2013


Languages
Bosnia's constitution does not specify any official languages;[44][45][46] however, academics Hilary Footitt and Michael Kelly note that the Dayton Agreement states that it is "done in Bosnian, Croatian, English and Serbian", and they describe this as the "de facto recognition of three official languages" at the state level. The equal status of Bosnian, Serbian and Croatian was verified by the Constitutional Court in 2000.[46] It ruled that the provisions of the Federation and Republika Srpska constitutions on language were incompatible with the state constitution, since they only recognised "Bosniak" and Croatian (in the case of the Federation) and Serbian (in the case of Republika Srpska) as official languages at the entity level.[citation needed]
As a result, the wording of the entity constitutions was changed and all three languages were made official in both entities.[46] The three languages are mutually intelligible and are also known collectively as Serbo-Croatian. Use of one of the three varieties has become a marker of ethnic identity.[47] Michael Kelly and Catherine Baker argue: "The three official languages of today's Bosnian state...represent the symbolic assertion of national identity over the pragmatism of mutual intelligibility".[48]
All standard varieties are based on the Ijekavian varieties of the Shtokavian dialect (non-standard spoken varieties including, beside Ijekavian, also Ikavian Shtokavian). Serbian and Bosnian are written in both Latin and Cyrillic (the latter predominantly using the Latin script), whereas Croatian is written only in Latin alphabet. There are also some speakers of Italian, German, Turkish and Ladino. Yugoslav Sign Language is used with Croatian and Serbian variants.[citation needed]
According to the results of the 2013 census, 52.86% of the population consider their mother tongue to be Bosnian, 30.76% Serbian, 14.6% Croatian and 1.57% another language, with 0.21% not giving an answer.[39]
 Linguistic structure of Bosnia and Herzegovina by municipalities in 2013
 Linguistic structure of Bosnia and Herzegovina by municipalities in 2013
 Share of Bosnian in Bosnia and Herzegovina by municipalities in 2013
 Share of Serbian in Bosnia and Herzegovina by municipalities in 2013
 Share of Croatian in Bosnia and Herzegovina by municipalities in 2013


Religion
According to the 2013 census, 50.7% of the population identify religiously as Muslim, 30.75% as Serbian Orthodox Christian, 15.19% as Roman Catholic, 1.15% as other, 1.1% as agnostic or atheist, with the remainder not declaring their religion or not answering.[39] A 2012 survey found that 47% of Bosnia's Muslims are non-denominational Muslims, while 45% follow Sunnism.[49] In Bosnia and Herzegovina, religion is strongly linked to ethnicity.
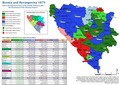 Religious structure of Bosnia and Herzegovina in 1879
 Religious structure of Bosnia and Herzegovina by municipalities in 2013
 Religious structure of Bosnia and Herzegovina by municipalities in 2013
 Share of Muslims in Bosnia and Herzegovina by municipalities in 2013
 Share of Orthodox Christians in Bosnia and Herzegovina by municipalities in 2013
 Share of Catholics in Bosnia and Herzegovina by municipalities in 2013


Remove ads
Demographic statistics
Summarize
Perspective

The following demographic statistics are from the CIA World Factbook, unless otherwise indicated.
Population
- 3,378,821[1]
Age structure
- 0-14 years: 13.18% (male 261,430/female 244,242)
- 15-24 years: 10.83% (male 214,319/female 201,214)
- 25-54 years: 44.52% (male 859,509/female 848,071)
- 55-64 years: 15.24% (male 284,415/female 300,168)
- 65 years and over: 16.22% (male 249,624/female 372,594) (2020 est.)
Median age
- Total: 43.3 years
- Male: 41.6 years
- Female: 44.8 years (2020 est.)
Sex ratio
- At birth: 1.07 male(s)/female
- 0-14 years: 1.07 male(s)/female
- 15-24 years: 1.07 male(s)/female
- 25-54 years: 1.01 male(s)/female
- 55-64 years: 0.95 male(s)/female
- 65 years and over: 0.67 male(s)/female
- Total population: 0.95 male(s)/female (2020 est.)
Infant mortality rate
- Total: 5.32 deaths/1,000 live births
- Male: 5.44 deaths/1,000 live births
- Female: 5.19 deaths/1,000 live births (2021 est.)
Life expectancy at birth
- Total population: 77.74 years
- Male: 74.76 years
- Female: 80.93 years (2021 est.)
HIV/AIDS
- Adult prevalence rate: less than 0.1% (2018)
- People living with HIV/AIDS: Less than 500 (2018)
- Deaths: less than 100 (2018)
Literacy
- Definition: age 15 and over can read and write
- Total population: 98.5%
- Male: 99.5%
- Female: 97.5% (2015 est.)
See also
- Demographic history of Bosnia and Herzegovina
- Yugoslavia § Demographics
- Demographics of Croatia
- Demographics of Montenegro
- Demographics of Serbia
- Exodus of Muslims from Serbia
- Bosnia and Herzegovina
- Federation of Bosnia and Herzegovina
- Republika Srpska
- Brčko District
- List of Bosnians and Herzegovinians
Religion:
- Islam in Bosnia and Herzegovina
- Serbian Orthodox Church
- Roman Catholicism in Bosnia and Herzegovina
- Jews in Bosnia and Herzegovina
Groups:
Remove ads
References
External links
Wikiwand - on
Seamless Wikipedia browsing. On steroids.
Remove ads