Top Qs
Timeline
Chat
Perspective
Δ13C
Measure of relative carbon-13 concentration in a sample From Wikipedia, the free encyclopedia
Remove ads
In geochemistry, paleoclimatology, and paleoceanography δ13C (pronounced "delta thirteen c") is an isotopic signature, a measure of the ratio of the two stable isotopes of carbon—13C and 12C—reported in parts per thousand (per mil, ‰).[1] The measure is also widely used in archaeology for the reconstruction of past diets, particularly to see if marine foods or certain types of plants were consumed.[2]

The definition is, in per mille:
where the standard is an established reference material.
δ13C varies in time as a function of productivity, the signature of the inorganic source, organic carbon burial, and vegetation type. Biological processes preferentially take up the lower mass isotope through kinetic fractionation. However some abiotic processes do the same. For example, methane from hydrothermal vents can be depleted by up to 50‰.[3]
Remove ads
Reference standard
Summarize
Perspective
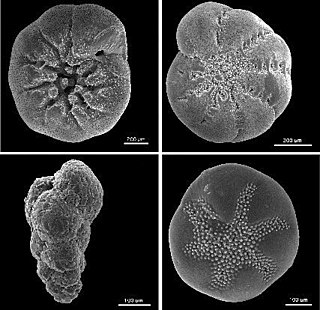
The standard established for carbon-13 work was the Pee Dee Belemnite (PDB) and was based on a Cretaceous marine fossil, Belemnitella americana, which was from the Peedee Formation in South Carolina. This material had an anomalously high 13C:12C ratio (0.0112372[4]), and was established as δ13C value of zero.
Since the original PDB specimen is no longer available, its 13C:12C ratio can be back-calculated from a widely measured carbonate standard NBS-19, which has a δ13C value of +1.95‰.[5] The 13C:12C ratio of NBS-19 was reported as .[6] Therefore, one could calculate the 13C:12C ratio of PDB derived from NBS-19 as .
Note that this value differs from the widely used PDB 13C:12C ratio of 0.0112372 used in isotope forensics[7] and by environmental scientists;[8] this discrepancy was previously attributed by a Wikipedia author to a sign error in the interconversion between standards, but no citation was provided. Use of the PDB standard gives most natural material a negative δ13C.[9] A material with a ratio of 0.010743 for example would have a δ13C value of −44‰ from .
The standards are used for verifying the accuracy of mass spectroscopy; as isotope studies became more common, the demand for the standard exhausted the supply. Other standards calibrated to the same ratio, including one known as VPDB (for "Vienna PDB"), have replaced the original.[10] The 13C:12C ratio for VPDB, which the International Atomic Energy Agency (IAEA) defines as a δ13C value of zero is 0.01123720.[11]
Remove ads
Causes of δ13C variations
Methane has a very light δ13C signature: biogenic methane of −60‰, thermogenic methane −40‰. The release of large amounts of methane clathrate can affect global δ13C values, as at the Paleocene–Eocene Thermal Maximum.[12]
More commonly, the ratio is affected by variations in primary productivity and organic burial. Organisms preferentially take up light 12C, and have a δ13C signature of about −25‰, depending on their metabolic pathway. Therefore, an increase in δ13C in marine fossils is indicative of an increase in the abundance of vegetation.[citation needed]
An increase in primary productivity causes a corresponding rise in δ13C values as more 12C is locked up in plants. This signal is also a function of the amount of carbon burial; when organic carbon is buried, more 12C is locked out of the system in sediments than the background ratio.
Remove ads
Geologic significance
C3 and C4 plants have different signatures, allowing the abundance of C4 grasses to be detected through time in the δ13C record.[13] Whereas C4 plants have a δ13C of −16 to −10‰, C3 plants have a δ13C of −33 to −24‰.[14]
Positive and negative excursions
Positive δ13C excursions are interpreted as an increase in burial of organic carbon in sedimentary rocks following either a spike in primary productivity, a drop in decomposition under anoxic ocean conditions or both.[15] For example, the evolution of large land plants in the late Devonian led to increased organic carbon burial and consequently a rise in δ13C.[16]
Major excursion events
- Lomagundi-Jatuli event (2,300–2,080 Ma) Paleoproterozoic - Positive excursion
- Shunga-Francevillian event (2,080 Ma) Paleoproterozoic - Negative excursion
- Shuram-Wonoka excursion (570–551 Ma) Neoproterozoic - Negative excursion
- Steptoean positive carbon isotope excursion (494.6-492 Ma) Paleozoic - Positive excursion
- Ireviken event (433.4 Ma) Paleozoic - Positive excursion
- Mulde event (427 Ma) Paleozoic - Positive excursion
- Cenomanian-Turonian boundary event (93.9 Ma) Mesozoic - Positive excursion
- Paleocene–Eocene Thermal Maximum (55.5 Ma) Cenozoic - Negative excursion
Remove ads
See also
References
Further reading
Wikiwand - on
Seamless Wikipedia browsing. On steroids.
Remove ads

![{\displaystyle \delta {{\vphantom {A}}_{\hphantom {}}^{\hphantom {13}}{\mkern {-1.5mu}}{\vphantom {A}}_{{\vphantom {2}}{\llap {\smash[{t}]{}}}}^{{\smash[{t}]{\vphantom {2}}}{\llap {13}}}\mathrm {C} }=\left({\frac {({{\vphantom {A}}_{\hphantom {}}^{\hphantom {13}}{\mkern {-1.5mu}}{\vphantom {A}}_{{\vphantom {2}}{\llap {\smash[{t}]{}}}}^{{\smash[{t}]{\vphantom {2}}}{\llap {13}}}\mathrm {C} }/{{\vphantom {A}}_{\hphantom {}}^{\hphantom {12}}{\mkern {-1.5mu}}{\vphantom {A}}_{{\vphantom {2}}{\llap {\smash[{t}]{}}}}^{{\smash[{t}]{\vphantom {2}}}{\llap {12}}}\mathrm {C} })_{\mathrm {sample} }}{({{\vphantom {A}}_{\hphantom {}}^{\hphantom {13}}{\mkern {-1.5mu}}{\vphantom {A}}_{{\vphantom {2}}{\llap {\smash[{t}]{}}}}^{{\smash[{t}]{\vphantom {2}}}{\llap {13}}}\mathrm {C} }/{{\vphantom {A}}_{\hphantom {}}^{\hphantom {12}}{\mkern {-1.5mu}}{\vphantom {A}}_{{\vphantom {2}}{\llap {\smash[{t}]{}}}}^{{\smash[{t}]{\vphantom {2}}}{\llap {12}}}\mathrm {C} })_{\mathrm {standard} }}}-1\right)\times 1000}](http://wikimedia.org/api/rest_v1/media/math/render/svg/ad4a2fc51a8f08aebed2a6cac104da521542659d)


