Top Qs
Timeline
Chat
Perspective
Ed Hawkins (climatologist)
British climate scientist known for data visualization graphics From Wikipedia, the free encyclopedia
Remove ads
Edward Hawkins MBE[4] (born 1977)[1] is a British climate scientist who is Professor of climate science at the University of Reading,[2] principal research scientist at the National Centre for Atmospheric Science (NCAS), editor of Climate Lab Book blog[5] and lead scientist for the Weather Rescue citizen science project.[6][7] He is known for his data visualizations of climate change for the general public such as warming stripes[8] and climate spirals.[9][10][11]
Remove ads
Education
Hawkins was educated at the University of Nottingham where he was awarded a PhD in astrophysics in 2003 for research supervised by Steve Maddox that investigated galaxy clustering in large redshift surveys.[3]
Career and research
Summarize
Perspective
After his PhD, Hawkins served as a Natural Environment Research Council (NERC) advanced research fellow in the department of meteorology at the University of Reading from 2005 to 2013.[12]
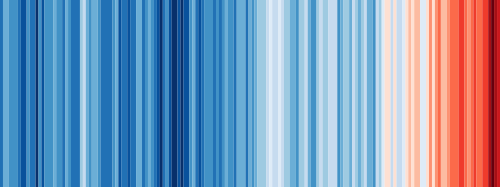
One of Hawkins' early warming stripes graphics shows global warming from 1850 (left side of graphic) to 2018 (right side of graphic).[13] Being a "minimalist graphic stripped (of) unnecessary clutter",[14] warming stripes portray observed global warming with blue stripes (cooler years) progressing to predominantly red stripes (warmer years).
Climate spiral shows global warming since 1850 as an ever-widening coloured spiral
As of 2025[update] Hawkins is a professor of climate science at the University of Reading,[15] where he serves as academic lead for public engagement and is affiliated with the National Centre for Atmospheric Science (NCAS).[16] He is a lead for Weather Rescue and Rainfall Rescue, citizen science projects in which volunteers transcribe data from historical meteorological and rainfall records for digital analysis.[17][18]
Hawkins was a contributing author for the IPCC Fifth Assessment Report (2014)[19] and was a lead author for the IPCC Sixth Assessment Report in 2021.[20]
On 9 May 2016, Hawkins published his climate spiral data visualization graphic,[21] which was widely reported as having gone viral.[11][22][23] The climate spiral was widely praised, Jason Samenow writing in The Washington Post that the spiral graph was "the most compelling global warming visualization ever made".[24]
On 22 May 2018, Hawkins published his warming stripes data visualization graphic,[25] which has been used by meteorologists in Climate Central's annual #MetsUnite campaign to raise public awareness of global warming during broadcasts on the summer solstice.[26] Hawkins' similar #ShowYourStripes initiative, in which the public could freely download and share graphics customized to specific countries or localities, was launched on 17 June 2019.[26] The warming stripes graphic is used in the logo of the U.S. House Select Committee on the Climate Crisis from 2019 onwards.[27]
Honours and awards
Hawkins' climate spiral design was on the shortlist for the Kantar Information is Beautiful Awards 2016,[28] the design having been featured in the opening ceremony of the August 2016 Summer Olympics in Rio de Janeiro.[29]
Hawkins was awarded the Royal Meteorological Society’s Climate Science Communication Prize in 2017.[20]
In 2018, Hawkins was awarded the Kavli Medal by the Royal Society "for significant contributions to understanding and quantifying natural climate variability and long-term climate change, and for actively communicating climate science and its various implications with broad audiences".[20]
In July 2019, Hawkins was included in the Climate Home News list of ten climate influencers.[30]
Hawkins was appointed Member of the Order of the British Empire (MBE) in the 2020 New Year Honours "For services to Climate Science and to Science Communication".[4]
In June 2021, Hawkins was named in The Sunday Times "Green Power List" which profiled twenty environmentalists in the UK who are "minds engaging with the world’s biggest problem".[31]
In May 2024, Hawkins received the Royal Geographical Society's Geographical Engagement Award for his work in developing warming stripes.[32]
In 2025, he was made an honorary fellow of Trinity College Dublin.[33]
Selected publications
According to Google Scholar[2][34][35] his most highly cited publications include:
Remove ads
References
External links
Wikiwand - on
Seamless Wikipedia browsing. On steroids.
Remove ads


