Top Qs
Timeline
Chat
Perspective
Mid Suffolk District Council elections
Local government elections in Suffolk, England From Wikipedia, the free encyclopedia
Remove ads
Mid Suffolk District Council elections are held every four years to elect members of Mid Suffolk District Council in Suffolk, England. Since the last boundary changes in 2019, there have been 34 councillors elected from 26 wards.[1]
Council elections
More information Year, Conservative ...
| Year | Conservative | Labour | Liberal Democrats[a] | Green | Independents & Others |
Council control after election | ||
|---|---|---|---|---|---|---|---|---|
| Local government reorganisation; council established (40 seats) | ||||||||
| 1973 | 6 | 9 | 1 | – | 24 | Independent | ||
| 1976 | 13 | 6 | 2 | 0 | 19 | No overall control | ||
| New ward boundaries[2] | ||||||||
| 1979 | 15 | 5 | 2 | 0 | 18 | No overall control | ||
| 1983 | 19 | 6 | 1 | 0 | 14 | No overall control | ||
| 1987 | 19 | 6 | 4 | 0 | 11 | No overall control | ||
| 1991 | 17 | 8 | 10 | 0 | 5 | No overall control | ||
| 1995 | 6 | 17 | 12 | 0 | 4 | No overall control | ||
| 1999 | 15 | 6 | 14 | 0 | 5 | No overall control | ||
| New ward boundaries[3][4] | ||||||||
| 2003 | 21 | 2 | 11 | 2 | 4 | Conservative | ||
| 2007 | 22 | 0 | 10 | 2 | 6[b] | Conservative | ||
| 2011 | 22 | 1 | 6 | 4 | 7[c] | Conservative | ||
| 2015 | 29 | 0 | 4 | 5 | 2 | Conservative | ||
| New ward boundaries; seats decreased from 40 to 34[1] | ||||||||
| 2019 | 16 | 0 | 5 | 12 | 1 | No overall control | ||
| 2023 | 6 | 0 | 4 | 24 | 0 | Green | ||
Close
Remove ads
Results maps
 2003 results map
 2007 results map
 2011 results map
 2015 results map
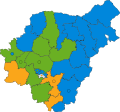 2019 results map
 2023 results map


By-election results
1995-1999
More information Party, Candidate ...
| Party | Candidate | Votes | % | ±% | |
|---|---|---|---|---|---|
| Conservative | 292 | 44.4 | |||
| Labour | 184 | 28.0 | |||
| Liberal Democrats | 182 | 27.7 | |||
| Majority | 108 | 16.4 | |||
| Turnout | 658 | 50.3 | |||
| Conservative gain from Independent | Swing | ||||
Close
1999-2003
More information Party, Candidate ...
| Party | Candidate | Votes | % | ±% | |
|---|---|---|---|---|---|
| Conservative | 546 | 61.4 | +8.0 | ||
| Liberal Democrats | John Ottley | 343 | 38.6 | −8.0 | |
| Majority | 203 | 22.8 | |||
| Turnout | 889 | 49.4 | |||
| Conservative hold | Swing | ||||
Close
More information Party, Candidate ...
| Party | Candidate | Votes | % | ±% | |
|---|---|---|---|---|---|
| Conservative | John Gilmour | 343 | 48.2 | −2.3 | |
| Labour | 257 | 36.1 | −13.4 | ||
| Green | 111 | 15.6 | +15.6 | ||
| Majority | 86 | 12.1 | |||
| Turnout | 711 | 41.1 | |||
| Conservative hold | Swing | ||||
Close
More information Party, Candidate ...
| Party | Candidate | Votes | % | ±% | |
|---|---|---|---|---|---|
| Liberal Democrats | Carol Millward | 726 | 77.6 | +68.1 | |
| Conservative | 209 | 22.4 | −16.3 | ||
| Majority | 517 | 55.2 | |||
| Turnout | 935 | 37.0 | |||
| Liberal Democrats gain from Conservative | Swing | ||||
Close
More information Party, Candidate ...
| Party | Candidate | Votes | % | ±% | |
|---|---|---|---|---|---|
| Conservative | Paul Debenham | 411 | 83.4 | +28.6 | |
| Labour | 82 | 16.6 | +16.6 | ||
| Majority | 329 | 66.8 | |||
| Turnout | 493 | 36.3 | |||
| Conservative hold | Swing | ||||
Close
2003-2007
More information Party, Candidate ...
| Party | Candidate | Votes | % | ±% | |
|---|---|---|---|---|---|
| Liberal Democrats | Robin Richardson | 281 | 51.1 | ||
| Conservative | 183 | 33.3 | |||
| UKIP | 86 | 15.6 | |||
| Majority | 98 | 17.8 | |||
| Turnout | 550 | 32.1 | |||
| Liberal Democrats hold | Swing | ||||
Close
More information Party, Candidate ...
| Party | Candidate | Votes | % | ±% | |
|---|---|---|---|---|---|
| Liberal Democrats | Martin Redbound | 617 | 57.7 | −0.7 | |
| Conservative | 374 | 35.0 | −6.6 | ||
| Labour | 78 | 7.3 | +7.3 | ||
| Majority | 243 | 22.7 | |||
| Turnout | 1,069 | 30.7 | |||
| Liberal Democrats hold | Swing | ||||
Close
More information Party, Candidate ...
| Party | Candidate | Votes | % | ±% | |
|---|---|---|---|---|---|
| Liberal Democrats | Evelyn Adey | 308 | 46.9 | +9.6 | |
| Conservative | Elizabeth Gibson-Harries | 295 | 45.0 | −17.7 | |
| Labour | Garry Deeks | 54 | 8.2 | +8.2 | |
| Majority | 13 | 1.9 | |||
| Turnout | 657 | 40.3 | |||
| Liberal Democrats gain from Conservative | Swing | ||||
Close
More information Party, Candidate ...
| Party | Candidate | Votes | % | ±% | |
|---|---|---|---|---|---|
| Liberal Democrats | John Field | 536 | 64.3 | ||
| Conservative | Michael Damant | 229 | 27.5 | ||
| Labour | Suzanne Britton | 68 | 8.2 | ||
| Majority | 307 | 36.8 | |||
| Turnout | 833 | 26.5 | |||
| Liberal Democrats gain from Conservative | Swing | ||||
Close
2007-2011
More information Party, Candidate ...
| Party | Candidate | Votes | % | ±% | |
|---|---|---|---|---|---|
| Green | Rachel Eburne | 444 | 61.0 | +45.4 | |
| Conservative | Samantha Powell | 176 | 24.2 | −20.9 | |
| Liberal Democrats | Christopher Vecchi | 51 | 7.0 | −32.4 | |
| Labour | David Hill | 32 | 4.4 | +4.4 | |
| UKIP | Christopher Streatfield | 25 | 3.4 | +3.4 | |
| Majority | 268 | 36.8 | |||
| Turnout | 728 | 41.6 | |||
| Green gain from Conservative | Swing | +33.2 | |||
Close
2011-2015
More information Party, Candidate ...
| Party | Candidate | Votes | % | ±% | |
|---|---|---|---|---|---|
| Conservative | Barry Humphreys | 707 | 31.8 | −1.8 | |
| UKIP | Stephen Searle | 616 | 27.7 | +18.0 | |
| Green | Nigel Rozier | 444 | 19.9 | −0.7 | |
| Labour | Anthony Elliott | 315 | 14.2 | −9.7 | |
| Liberal Democrats | Nichola Willshere | 144 | 6.5 | −5.6 | |
| Majority | 91 | 4.1 | |||
| Turnout | 2,226 | ||||
| Conservative hold | Swing | ||||
Close
2015-2019
More information Party, Candidate ...
| Party | Candidate | Votes | % | ±% | |
|---|---|---|---|---|---|
| Green | Anne Marie Killett | 212 | 34.5 | +34.5 | |
| Conservative | Jemma Lynch | 210 | 34.2 | −7.5 | |
| Liberal Democrats | Mark Valladares | 154 | 25.1 | +13.2 | |
| Labour | Will Marsburg | 38 | 6.2 | +6.2 | |
| Majority | 2 | 0.3 | |||
| Turnout | 617 | 34.1 | |||
| Green gain from Conservative | Swing | +21.0 | |||
Close
More information Party, Candidate ...
| Party | Candidate | Votes | % | ±% | |
|---|---|---|---|---|---|
| Conservative | Michael Burke | 438 | 52.3 | +52.3 | |
| Green | Simon Hooton | 220 | 26.3 | −19.1 | |
| Liberal Democrats | John Blake | 112 | 13.4 | +13.4 | |
| Labour | Alex Wilson | 68 | 8.1 | +8.1 | |
| Majority | 218 | 26.0 | |||
| Turnout | 838 | ||||
| Conservative gain from Independent | Swing | ||||
Close
2019-2023
More information Party, Candidate ...
| Party | Candidate | Votes | % | ±% | |
|---|---|---|---|---|---|
| Green | Austin Davies | 845 | 64.4 | +25.2 | |
| Conservative | Philippa Wilding | 399 | 30.4 | −3.5 | |
| Liberal Democrats | Timothy Glenton | 37 | 2.8 | −8.2 | |
| Labour | Terence Wilson | 32 | 2.4 | −4.9 | |
| Majority | 446 | 34.0 | |||
| Turnout | 1,313 | ||||
| Green hold | Swing | ||||
Close
2023-2027
More information Party, Candidate ...
| Party | Candidate | Votes | % | ±% | |
|---|---|---|---|---|---|
| Green | Lorraine Baker | 589 | 47.2 | ||
| Conservative | Steven Runciman | 375 | 30.0 | ||
| Labour | William Howman | 285 | 22.8 | ||
| Majority | 214 | 17.1 | |||
| Turnout | 1,249 | ||||
| Green hold | Swing | ||||
Close
More information Party, Candidate ...
| Party | Candidate | Votes | % | ±% | |
|---|---|---|---|---|---|
| Conservative | Harry Richardson | 579 | 49.2 | ||
| Green | Oscar Barrick-Cook | 518 | 44.0 | ||
| Labour | Nathan Hope | 79 | 6.7 | ||
| Majority | 61 | 5.2 | |||
| Turnout | 1,176 | ||||
| Conservative gain from Green | Swing | ||||
Close
More information Party, Candidate ...
| Party | Candidate | Votes | % | ±% | |
|---|---|---|---|---|---|
| Green | Agnes Watson | 901 | 64.1 | ||
| Conservative | Kieren Clayton | 444 | 31.6 | ||
| Liberal Democrats | Timothy Glenton | 61 | 4.3 | ||
| Majority | 457 | 32.5 | |||
| Turnout | 1,406 | ||||
| Green hold | Swing | ||||
Close
Remove ads
Notes
References
External links
Wikiwand - on
Seamless Wikipedia browsing. On steroids.
Remove ads
Remove ads