Top Qs
Timeline
Chat
Perspective
Ramberg–Osgood relationship
Nonlinear relationship between stress and strain From Wikipedia, the free encyclopedia
Remove ads
The Ramberg–Osgood equation was created to describe the nonlinear relationship between stress and strain—that is, the stress–strain curve—in materials near their yield points. It is especially applicable to metals that harden with plastic deformation (see work hardening), showing a smooth elastic-plastic transition. As it is a phenomenological model, checking the fit of the model with actual experimental data for the particular material of interest is essential.
Remove ads
Functional Relationship
Summarize
Perspective
In its original form, the equation for strain (deformation) is[1]
here
- is strain,
- is stress,
- is Young's modulus, and
- and are constants that depend on the material being considered. In this form, K and n are not the same as the constants commonly seen in the Hollomon equation.[2]
The equation is essentially assuming the elastic strain portion of the stress-strain curve, , can be modeled with a line, while the plastic portion, , can be modeled with a power law. The elastic and plastic components are summed to find the total strain.
The first term on the right side, , is equal to the elastic part of the strain, while the second term, , accounts for the plastic part, the parameters and describing the hardening behavior of the material. Introducing the yield strength of the material, , and defining a new parameter, , related to as , it is convenient to rewrite the term on the extreme right side as follows:
Replacing in the first expression, the Ramberg–Osgood equation can be written as
Hardening behavior and yield offset
In the last form of the Ramberg–Osgood model, the hardening behavior of the material depends on the material constants and . Due to the power-law relationship between stress and plastic strain, the Ramberg–Osgood model implies that plastic strain is present even for very low levels of stress. Nevertheless, for low applied stresses and for the commonly used values of the material constants and , the plastic strain remains negligible compared to the elastic strain. On the other hand, for stress levels higher than , plastic strain becomes progressively larger than elastic strain.
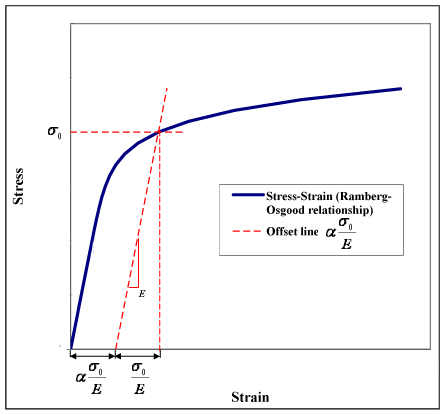
The value can be seen as a yield offset, as shown in figure 1. This comes from the fact that , when .
Accordingly, (see Figure 1):
- elastic strain at yield =
- plastic strain at yield = = yield offset
Commonly used values for are ~5 or greater, although more precise values are usually obtained by fitting of tensile (or compressive) experimental data. Values for can also be found by means of fitting to experimental data, although for some materials, it can be fixed in order to have the yield offset equal to the accepted value of strain of 0.2%, which means:

Remove ads
Alternative Parameterizations
Summarize
Perspective
Several slightly different alternative formulations of the Ramberg–Osgood equation can be found. As the models are purely empirical, it is often useful to try different models and check which has the best fit with the chosen material.
The Ramberg–Osgood equation can also be expressed using the Hollomon parameters[3] where is the strength coefficient (Pa) and is the strain hardening coefficient (no units).[4]
Alternatively, if the yield stress, , is assumed to be at the 0.2% offset strain, the following relationship can be derived.[5] Note that is again as defined in the original Ramberg–Osgood equation and is the inverse of the Hollomon's strain hardening coefficient.
Remove ads
Alternative Models
The Ramberg-Osgood model provides an explicit formula for obtaining strain from stress , but in general an iterative solve must be performed for the inverse relation from strain to stress. This can be computationally demanding, and is not well suited for applications like Finite element analysis where the inverse mapping from strain to stress is generally required. For this reason, several alternative curves have become common in these contexts. One such example is the curve proposed by [6]
where is the yield point, is the strain hardening parameter, and the parameter influences the shape of the transition curve and takes account of the Bauschinger effect.
Remove ads
See also
References
Wikiwand - on
Seamless Wikipedia browsing. On steroids.
Remove ads


