Top Qs
Timeline
Chat
Perspective
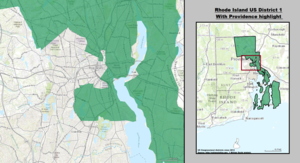
Rhode Island's 1st congressional district

Remove ads
Rhode Island's 1st congressional district is a congressional district in the U.S. state of Rhode Island. It includes all of Bristol and Newport counties, along with parts of Providence County, including most of the city of Providence.
Quick facts Representative, Distribution ...
| Rhode Island's 1st congressional district | |
|---|---|
.svg)  Interactive map of district boundaries since January 3, 2023 | |
| Representative | |
| Distribution |
|
| Population (2023) | 536,470 |
| Median household income | $81,386[1] |
| Ethnicity |
|
| Cook PVI | D+12[2] |
Close
The district was made vacant in 2023 by the resignation of Democrat David Cicilline, who served from 2011 to 2023.[3] He was succeeded by Democrat Gabe Amo, a former Biden White House aide and the first Black person to represent Rhode Island as a member of Congress.[4]
Remove ads
Composition
- Bristol County (3)
- All 3 municipalities
Newport County (6)
- All 6 municipalities
Providence County (10)
- Central Falls, Cumberland, East Providence, Lincoln, North Providence, North Smithfield, Pawtucket, Providence (part; also 2nd), Smithfield, Woonsocket
Voter registration
More information Voter registration and party enrollment as of November 1, 2012, Party ...
| Voter registration and party enrollment as of November 1, 2012[5] | |||||
|---|---|---|---|---|---|
| Party | Active voters | Inactive voters | Total voters | Percentage | |
| Democratic | 156,784 | 11,392 | 168,176 | 40.39% | |
| Republican | 71,932 | 3,348 | 75,280 | 18.08% | |
| Unaffiliated | 161,327 | 11,299 | 172,626 | 41.46% | |
| Minor parties | 301 | 29 | 330 | 0.07% | |
| Total | 390,334 | 26,068 | 416,412 | 100% | |
Close
Remove ads
Recent election results from statewide races
More information Year, Office ...
| Year | Office | Results[6] |
|---|---|---|
| 2008 | President | Obama 66% - 32% |
| 2012 | President | Obama 67% - 33% |
| 2014 | Governor | Raimondo 45% - 31% |
| 2016 | President | Clinton 59% - 34% |
| 2018 | Senate | Whitehouse 66% - 34% |
| Governor | Raimondo 59% - 31% | |
| Lt. Governor | McKee 66% - 25% | |
| 2020 | President | Biden 63% - 35% |
| Senate | Reed 70% - 29% | |
| 2022 | Governor | McKee 62% - 35% |
| Lt. Governor | Matos 56% - 38% | |
| Attorney General | Neronha 66% - 34% | |
| Secretary of State | Amore 64% - 36% | |
| General Treasurer | Diossa 59% - 41% | |
| 2024 | President | Harris 60% - 38% |
| Senate | Whitehouse 64% - 36% |
Close
Remove ads
List of members representing the district
More information Representative, Party ...
.jpg)


.jpg)
.jpg)
.jpg)

.jpg)


.jpg)
.jpg)


.jpg)

Close
Remove ads
Election history
2006
More information Party, Candidate ...
| Party | Candidate | Votes | % | ±% | |
|---|---|---|---|---|---|
| Democratic | Patrick Kennedy (incumbent) | 124,634 | 69.20 | +5.14 | |
| Republican | Jonathan Scott | 41,836 | 23.23 | −12.57 | |
| Independent | Kenneth Capalbo | 13,634 | 7.57 | ||
| Democratic hold | Swing | ||||
| Turnout | 180,104 | ||||
Close
2008
More information Party, Candidate ...
| Party | Candidate | Votes | % | ±% | |
|---|---|---|---|---|---|
| Democratic | Patrick Kennedy (incumbent) | 145,254 | 68.52 | −0.68 | |
| Republican | Jonathan Scott | 51,340 | 24.22 | +0.99 | |
| Independent | Kenneth Capalbo | 15,108 | 7.13 | −0.44 | |
| Independent | Write-in votes | 296 | 0.14 | ||
| Democratic hold | Swing | ||||
| Turnout | 211,998 | ||||
Close
2010
More information Party, Candidate ...
| Party | Candidate | Votes | % | ±% | |
|---|---|---|---|---|---|
| Democratic | David Cicilline | 81,269 | 50.54 | −17.98 | |
| Republican | John Loughlin | 71,542 | 44.49 | +20.27 | |
| Independent | Kenneth Capalbo | 6,424 | 3.99 | −3.14 | |
| Independent | Gregory Raposa | 1,334 | 1.13 | 0.83 | |
| Independent | Write-in votes | 245 | 0.15 | +0.01 | |
| Democratic hold | Swing | ||||
| Turnout | 160,814 | ||||
Close
2012
More information Party, Candidate ...
| Party | Candidate | Votes | % | ±% | |
|---|---|---|---|---|---|
| Democratic | David Cicilline (incumbent) | 108,612 | 52.95 | +2.41 | |
| Republican | Brendan Doherty | 83,737 | 40.82 | −3.67 | |
| Independent | David Vogel | 12,504 | 6.10 | +2.11 | |
| Independent | Write-in votes | 262 | 0.13 | −0.02 | |
| Democratic hold | Swing | ||||
| Turnout | 205,115 | ||||
Close
2014
More information Party, Candidate ...
| Party | Candidate | Votes | % | |
|---|---|---|---|---|
| Democratic | David Cicilline (incumbent) | 87,060 | 59.5 | |
| Republican | Cormick Lynch | 58,877 | 40.2 | |
| n/a | Write-ins | 416 | 0.3 | |
| Total votes | 146,353 | 100.0 | ||
| Democratic hold | ||||
Close
2016
More information Party, Candidate ...
| Party | Candidate | Votes | % | |
|---|---|---|---|---|
| Democratic | David Cicilline (incumbent) | 130,540 | 64.5 | |
| Republican | Harold Russell Taub | 71,023 | 35.1 | |
| n/a | Write-ins | 814 | 0.4 | |
| Total votes | 202,371 | 100.0 | ||
| Democratic hold | ||||
Close
2018
More information Party, Candidate ...
| Party | Candidate | Votes | % | |
|---|---|---|---|---|
| Democratic | David Cicilline (incumbent) | 116,099 | 66.7 | |
| Republican | Patrick Donovan | 57,567 | 33.1 | |
| n/a | Write-ins | 417 | 0.2 | |
| Total votes | 174,083 | 100.0 | ||
| Democratic hold | ||||
Close
2020
More information Party, Candidate ...
| Party | Candidate | Votes | % | ||
|---|---|---|---|---|---|
| Democratic | David Cicilline (incumbent) | 158,550 | 70.8 | ||
| Independent | Jeffrey Lemire | 35,457 | 15.8 | ||
| Independent | Frederick Wysocki | 28,300 | 12.6 | ||
| Write-in | 1,553 | 0.7 | |||
| Total votes | 223,860 | 100.0 | |||
| Democratic hold | |||||
Close
2022
More information Party, Candidate ...
| Party | Candidate | Votes | % | ||
|---|---|---|---|---|---|
| Democratic | David Cicilline (incumbent) | 99,802 | 64.0 | ||
| Republican | Allen Waters | 55,909 | 35.8 | ||
| Write-in | 361 | 0.2 | |||
| Total votes | 155,711 | 100.0 | |||
| Democratic hold | |||||
Close
2023
More information Party, Candidate ...
| Party | Candidate | Votes | % | ||
|---|---|---|---|---|---|
| Democratic | Gabe Amo | 43,282 | 64.7 | ||
| Republican | Gerry Leonard | 23,391 | 34.9 | ||
| Write-in | 193 | 0.2 | |||
| Total votes | 66,866 | 100.0 | |||
| Democratic hold | |||||
Close
2024
More information Party, Candidate ...
| Party | Candidate | Votes | % | ||
|---|---|---|---|---|---|
| Democratic | Gabe Amo (incumbent) | 139,352 | 63.0 | ||
| Republican | Allen Waters | 70,742 | 31.9 | ||
| Independent | CD Reynolds | 10,463 | 4.7 | ||
| Write-in | 561 | 0.2 | |||
| Total votes | 221,118 | 100.0 | |||
| Democratic hold | |||||
Close
Remove ads
Historical district boundaries

2003 - 2013

2013 - 2023
See also
References
Wikiwand - on
Seamless Wikipedia browsing. On steroids.
Remove ads
Remove ads