Top Qs
Timeline
Chat
Perspective
Solar minimum
Regular period of least solar activity From Wikipedia, the free encyclopedia
Remove ads
Solar minimum is the regular period of least solar activity in the Sun's 11-year solar cycle. During solar minimum, sunspot and solar flare activity diminishes, and often does not occur for days at a time. On average, the solar cycle takes about 11 years to go from one solar minimum to the next, with duration observed varying from 9 to 14 years. The date of the minimum is described by a smoothed average over 12 months of sunspot activity, so identifying the date of the solar minimum usually can only happen 6 months after the minimum takes place.

Solar minimum is contrasted with the solar maximum, when hundreds of sunspots may occur.
Remove ads
Solar minimum and solar maximum
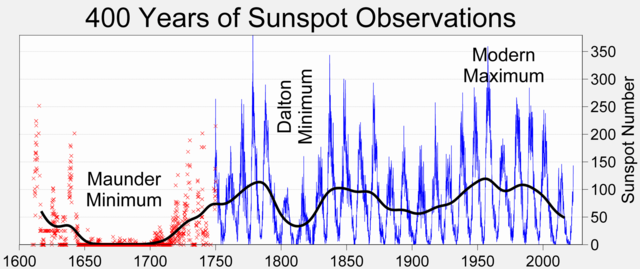
Solar minima and maxima are the two extremes of the Sun's 11-year and 400-year activity cycle.[1] At a maximum, the Sun is peppered with sunspots, solar flares erupt, and the Sun hurls billion-ton clouds of electrified gas into space. Sky watchers may see more auroras, and space agencies must monitor radiation storms for astronaut protection. Power outages, satellite malfunctions, communication disruptions, and GPS receiver malfunctions are just a few of the things that can happen during a solar maximum.[2]
At a solar minimum, there are fewer sunspots and solar flares subside. Sometimes, days or weeks go by without a spot.
Remove ads
Predicting solar minimum cycles
Summarize
Perspective
Their non-linear character makes predictions of solar activity very difficult.[3] The solar minimum is characterized by a period of decreased solar activity with few, if any, sunspots. Scientists from the National Center for Atmospheric Research (NCAR) also developed a computer model of solar dynamics (Solar dynamo) for more accurate predictions and have confidence in the forecast based upon a series of test runs with the newly developed model simulating the strength of the past eight solar cycles with more than 98% accuracy.[4] In hindsight the prediction proved to be wildly inaccurate and not representative of the observed sunspot numbers.[5]
During 2008–09 NASA scientists noted that the Sun is undergoing a "deep solar minimum," stating: "There were no sunspots observed on 266 of [2008's] 366 days (73%). Prompted by these numbers, some observers suggested that the solar cycle had hit bottom in 2008. Sunspot counts for 2009 dropped even lower. As of September 14, 2009 there were no sunspots on 206 of the year's 257 days (80%). Solar physicist Dean Pesnell of the Goddard Space Flight Center came to the following conclusion: "We're experiencing a very deep solar minimum." His statement was confirmed by other specialists in the field. "This is the quietest sun we've seen in almost a century," agreed sunspot expert David Hathaway of the National Space Science and Technology Center NASA/Marshall Space Flight Center.[6] However, the activity is still at a higher level than at a grand solar minimum.
Remove ads
Grand solar minima and maxima
Grand solar minima occur when several solar cycles exhibit lesser than average activity for decades or centuries. Solar cycles still occur during these grand solar minimum periods but are at a lower intensity than usual. The grand minima form a special mode of the solar dynamo operation.[7]

A list of historical Grand minima of solar activity[9] includes also Grand minima ca. 690 AD, 360 BC, 770 BC, 1390 BC, 2860 BC, 3340 BC, 3500 BC, 3630 BC, 3940 BC, 4230 BC, 4330 BC, 5260 BC, 5460 BC, 5620 BC, 5710 BC, 5990 BC, 6220 BC, 6400 BC, 7040 BC, 7310 BC, 7520 BC, 8220 BC, 9170 BC.
See also
References
External links
Wikiwand - on
Seamless Wikipedia browsing. On steroids.
Remove ads
