From 1928 until May 1973, Belfast was divided into 15 wards, each represented by a total of four aldermen or councillors. The 15 wards were Duncairn, Dock, Clifton, Shankill, Court, Woodvale, Smithfield, Falls, Saint Anne's, Saint George's, Windsor, Cromac, Ormeau, Pottinger and Victoria.
By the early 1970s, population shifts had resulted in significant differences in the electorates of the wards. Although the wards continued to have four representatives on Belfast City Council, electorates varied from less than 5,000 in the smallest ward, Smithfield, to almost 40,000 in the largest ward, Victoria. The review of local government which took place in the early 1970s expanded Belfast to take in some of the newer housing estates on the fringes of the city and attempted to equalise electorates. Initially, Belfast was to have been divided into 52 wards. Following a public review, one ward, Tullycarnet, was excluded from Belfast and became instead the Castlereagh wards of Tullycarnet and Gilnahirk. The remaining 51 wards were intended to elect one member each using the first past the post electoral system. The reintroduction of the single transferable vote method of election meant that a different system was required. The 51 wards were therefore grouped into 8 electoral areas, distinguished by letters, with each electoral area returning either 6 or 7 councillors.
By the early 1980s, population shifts, demolition of some the older housing estates and residential flight caused by the Troubles had again led to substantial disparities in the electorates of the wards. Some wards in inner city Belfast such as Crumlin had lost over 70% of their population. The review of local government which took place from 1982 to 1984 created 51 wards, many new or substantially different from their namesakes. The initial proposals, published in 1983, survived unchanged with a few exceptions. The proposed Peter's Hill ward was renamed Saint Anne's. The Donegall ward, one of the few unchanged wards, was renamed Blackstaff. In inner south Belfast, the Saint George's, university and Cromac wards were to have been replaced with an eastern ward, to be called Linenhall, and a western ward, to be called College. Following public inquiries, the wards were replaced with a southern ward, Botanic, and a northern ward, Shaftesbury, which merged the former Cromac and Saint George's wards. As in 1973, these wards were grouped into electoral areas electing between 5 and 7 councillors.
A further review took place in 1991–1992 and compared to the review of the 1980s, saw minor changes. In the Court electoral area, the existing Shankill ward was split between three other wards. One of these three wards which gained territory, Saint Anne's, having lost its eponymous area to the Duncairn ward, assumed the Shankill name. Initially, the number of wards was to have been cut to 50, however after a public inquiry, a new 51st ward was created. Most of the existing Finaghy ward was renamed Musgrave, while a new Finaghy ward was created from the southern parts of the older Finaghy ward and the Upper Malone ward, which compensated by gaining territory from Malone and Stranmillis wards.
1993–2013
The table below shows the divisions from 1993 to 2013.
More information Map, District Electoral Area ...
| Map | District Electoral Area | Councillors/
Wards | Population
(2011 Census) | Catholic community background (%) | Protestant community background (%) | Other
religious community background (%) |
No religious community background (%) | Area | Density | NI Assembly | UK Parliament |
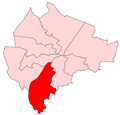 | Balmoral | 6 | 32,017 | 43.8% | 44.8% | 3.1% |
8.3% | 13.71 km2 | 2,335/km2 | Belfast South | Belfast South |
 | Castle | 6 | 29,366 | 50.3% | 41.5% | 1.4% |
6.9% | 19 km2 | 1,546/km2 | Belfast North | Belfast North |
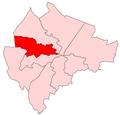 | Court | 5 | 21,886 | 10.3% | 82.5% | 0.7% |
6.5% | 9.12 km2 | 2,400/km2 | Belfast North (2)
Belfast West (3) | Belfast North (2)
Belfast West (3) |
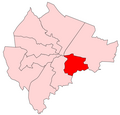
 | Laganbank | 5 | 36,790 | 51.9% | 33.3% | 3.8% |
11% | 8.27 km2 | 4,449/km2 | Belfast South | Belfast South |
 | Lower Falls | 5 | 26,588 | 91.1% | 5.8% | 0.3% |
1.8% | 5.93 km2 | 4,484/km2 | Belfast West | Belfast West |
 | Oldpark | 6 | 34,131 | 65.6% | 29.2% | 0.8% |
4.4% | 13.68 km2 | 2,495 /km2 | Belfast North | Belfast North |
 | Pottinger | 6 | 33,057 | 25.3% | 61.2% | 1.8% |
11.7% | 6.17 km2 | 5,358 /km2 | Belfast East (4)
Belfast South (2) | Belfast East (4)
Belfast South (2) |
 | Upper Falls | 5 | 28,840 | 92.2% | 5.5% | 0.5% |
1.8% | 15.83 km2 | 1,822/km2 | Belfast West | Belfast West |
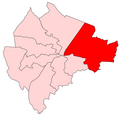 | Victoria | 7 | 38,287 | 12.4% | 75% | 1.7% |
10.8% | 23.14 km2 | 1,655 /km2 | Belfast East | Belfast East |
| Belfast City Council | 51 | 280,962 | 48.6% | 42.3% | 1.7% |
7.4% | 114.85 km2 | 2,446 /km2 | |
|
Close
- Note: data for DEAs in the above table is based on aggregating the referenced figures for the relevant wards in the table below.
More information Ward, District Electoral Area ...
| Ward | District Electoral Area | Population
(2011 Census) | Catholic community background (%) | Protestant community background (%) | Other
religious community background (%) |
No religious community background (%) | Area | Density | NI Assembly | UK Parliament | Ref |
| Andersonstown | Upper Falls | 4,907 | 94.54 | 3.59 | 0.26 |
1.61 | 1.08 km2 | 4,544/km2 | Belfast West | Belfast West | [4] |
| Ardoyne | Oldpark | 5,987 | 92.83 | 5.11 | 0.25 |
1.80 | 0.58 km2 | 10,322/km2 | Belfast North | Belfast North | [5] |
| Ballyhackamore | Victoria | 5,939 | 17.24 | 68.16 | 1.90 |
12.70 | 1.15 km2 | 5,164/km2 | Belfast East | Belfast East | [6] |
| Ballymacarrett | Pottinger | 4,908 | 51.39 | 41.16 | 1.41 |
6.05 | 0.78 km2 | 6,292/km2 | Belfast East | Belfast East | [7] |
| Ballynafeigh | Laganbank | 5,928 | 56.95 | 27.11 | 2.85 |
13.09 | 0.67 km2 | 8,848/km2 | Belfast South | Belfast South | [8] |
| Ballysillan | Oldpark | 5,626 | 7.79 | 83.31 | 1.37 |
7.54 | 1.11 km2 | 5,068/km2 | Belfast North | Belfast North | [9] |
| Beechmount | Lower Falls | 5,485 | 90.81 | 6.09 | 0.64 |
2.46 | 0.84 km2 | 6,530/km2 | Belfast West | Belfast West | [10] |
| Bellevue | Castle | 4,910 | 63.69 | 29.25 | 1.08 |
5.99 | 2.96 km2 | 1,659/km2 | Belfast North | Belfast North | [11] |
| Belmont | Victoria | 6,165 | 8.61 | 80.63 | 0.99 |
9.76 | 1.79 km2 | 3,444/km2 | Belfast East | Belfast East | [12] |
| Blackstaff | Balmoral | 3,998 | 15.01 | 71.51 | 1.83 |
11.66 | 1.92 km2 | 2,082/km2 | Belfast South | Belfast South | [13] |
| Bloomfield | Pottinger | 5,453 | 16.10 | 69.72 | 1.69 |
12.49 | 0.74 km2 | 7,369/km2 | Belfast East | Belfast East | [14] |
| Botanic | Laganbank | 8,945 | 60.83 | 23.25 | 3.90 |
12.02 | 1.3 km2 | 6,881/km2 | Belfast South | Belfast South | [15] |
| Castleview | Castle | 4,722 | 38.14 | 54.19 | 1.19 |
6.48 | 1.41 km2 | 3,349/km2 | Belfast North | Belfast North | [16] |
| Cavehill | Castle | 4,820 | 57.14 | 37.70 | 0.87 |
4.29 | 3.41 km2 | 1,413/km2 | Belfast North | Belfast North | [17] |
| Cherryvalley | Victoria | 5,920 | 14.46 | 75.27 | 0.84 |
9.43 | 1.99 km2 | 2,975/km2 | Belfast East | Belfast East | [18] |
| Chichester Park | Castle | 5,452 | 74.34 | 17.20 | 1.58 |
6.88 | 0.95 km2 | 5,739/km2 | Belfast North | Belfast North | [19] |
| Cliftonville | Oldpark | 5,330 | 71.01 | 23.60 | 0.68 |
4.71 | 1.18 km2 | 4,517/km2 | Belfast North | Belfast North | [20] |
| Clonard | Lower Falls | 4,975 | 90.45 | 6.35 | 0.64 |
2.55 | 0.61 km2 | 8,156/km2 | Belfast West | Belfast West | [21] |
| Crumlin | Court | 4,582 | 11.33 | 82.28 | 0.55 |
5.85 | 0.83 km2 | 5,520/km2 | Belfast North | Belfast North | [22] |
| Duncairn | Castle | 4,901 | 23.57 | 63.88 | 2.24 |
10.30 | 9.24 km2 | 530/km2 | Belfast North | Belfast North | [23] |
| Falls | Lower Falls | 5,184 | 87.56 | 7.52 | 2.31 |
2.60 | 1.2 km2 | 4,320/km2 | Belfast West | Belfast West | [24] |
| Falls Park | Upper Falls | 5,343 | 94.40 | 3.28 | 0.73 |
1.59 | 2.35 km2 | 2,274/km2 | Belfast West | Belfast West | [25] |
| Finaghy | Balmoral | 4,555 | 49.18 | 42.63 | 2.63 |
5.55 | 2.59 km2 | 1,759/km2 | Belfast South | Belfast South | [26] |
| Fortwilliam | Castle | 4,561 | 41.28 | 50.34 | 1.16 |
7.21 | 1.03 km2 | 4,428/km2 | Belfast North | Belfast North | [27] |
| Glen Road | Upper Falls | 5,573 | 95.14 | 3.25 | 0.52 |
1.09 | 1.57 km2 | 3,550/km2 | Belfast West | Belfast West | [28] |
| Glencairn | Court | 3,749 | 17.47 | 75.54 | 0.85 |
6.13 | 4.1 km2 | 914/km2 | Belfast West | Belfast West | [29] |
| Glencolin | Upper Falls | 6,498 | 93.15 | 5.11 | 0.20 |
1.54 | 9.54 km2 | 681/km2 | Belfast West | Belfast West | [30] |
| Highfield | Court | 5,651 | 9.49 | 82.59 | 0.88 |
7.04 | 2.69 km2 | 2,101/km2 | Belfast West | Belfast West | [31] |
| Island | Victoria | 5,014 | 13.88 | 69.78 | 4.55 |
11.79 | 3.81 km2 | 1,316/km2 | Belfast East | Belfast East | [32] |
| Knock | Victoria | 4,827 | 9.14 | 79.66 | 1.22 |
9.99 | 1.12 km2 | 4,310/km2 | Belfast East | Belfast East | [33] |
| Ladybrook | Upper Falls | 6,519 | 85.30 | 10.94 | 0.64 |
3.11 | 1.29 km2 | 5,053/km2 | Belfast West | Belfast West | [34] |
| Legoniel | Oldpark | 6,409 | 48.24 | 45.40 | 0.76 |
5.59 | 8.82 km2 | 727/km2 | Belfast North | Belfast North | [35] |
| Malone | Balmoral | 5,555 | 61.17 | 30.28 | 2.29 |
6.26 | 2.18 km2 | 2,548/km2 | Belfast South | Belfast South | [36] |
| Musgrave | Balmoral | 4,927 | 60.56 | 32.94 | 1.68 |
4.81 | 1.78 km2 | 2,768/km2 | Belfast South | Belfast South | [37] |
| New Lodge | Oldpark | 4,950 | 89.23 | 7.64 | 0.87 |
2.26 | 0.72 km2 | 6,875/km2 | Belfast North | Belfast North | [38] |
| Orangefield | Pottinger | 5,619 | 11.02 | 76.95 | 1.44 |
10.59 | 1.46 km2 | 3,849/km2 | Belfast East | Belfast East | [39] |
| Ravenhill | Pottinger | 6,041 | 39.65 | 46.90 | 2.00 |
11.46 | 1.88 km2 | 3,213/km2 | Belfast South | Belfast South | [40] |
| Rosetta | Laganbank | 6,564 | 59.00 | 30.59 | 2.04 |
8.36 | 1.6 km2 | 4,103/km2 | Belfast South | Belfast South | [41] |
| Shaftesbury | Laganbank | 7,214 | 35.31 | 47.32 | 6.72 |
10.65 | 2.23 km2 | 3,235/km2 | Belfast South | Belfast South | [42] |
| Shankill | Court | 3,816 | 7.86 | 84.51 | 0.68 |
6.94 | 0.93 km2 | 4,103/km2 | Belfast West | Belfast West | [43] |
| Stormont | Victoria | 5,548 | 12.94 | 75.63 | 1.28 |
10.15 | 7.04 km2 | 788/km2 | Belfast East | Belfast East | [44] |
| Stranmillis | Laganbank | 8,139 | 47.30 | 38.67 | 3.05 |
10.98 | 2.47 km2 | 3,295/km2 | Belfast South | Belfast South | [45] |
| Sydenham | Victoria | 4,874 | 9.91 | 76.00 | 1.81 |
12.29 | 6.24 km2 | 781/km2 | Belfast East | Belfast East | [46] |
| The Mount | Pottinger | 5,591 | 16.13 | 68.32 | 1.27 |
14.27 | 0.75 km2 | 7,455/km2 | Belfast East | Belfast East | [47] |
| Upper Malone | Balmoral | 4,841 | 29.37 | 60.05 | 2.52 |
8.06 | 4.32 km2 | 1,121/km2 | Belfast South | Belfast South | [48] |
| Upper Springfield | Lower Falls | 5,250 | 93.50 | 4.59 | 0.32 |
1.58 | 2.5 km2 | 2,100/km2 | Belfast West | Belfast West | [49] |
| Water Works | Oldpark | 5,829 | 87.63 | 7.09 | 0.89 |
4.39 | 1.27 km2 | 4,590/km2 | Belfast North | Belfast North | [50] |
| Whiterock | Lower Falls | 5,694 | 93.12 | 4.74 | 0.30 |
1.84 | 0.78 km2 | 7,300/km2 | Belfast West | Belfast West | [51] |
| Windsor | Balmoral | 8,141 | 41.63 | 40.73 | 5.80 |
11.84 | 0.92 km2 | 8,849/km2 | Belfast South | Belfast South | [52] |
| Woodstock | Pottinger | 5,445 | 19.38 | 63.31 | 2.81 |
14.51 | 0.56 km2 | 9,723/km2 | Belfast South | Belfast South | [53] |
| Woodvale | Court | 4,088 | 6.02 | 86.96 | 0.59 |
6.43 | 0.57 km2 | 7,172/km2 | Belfast North | Belfast North | [54] |
| Belfast City Council | 280,962 | 48.58 | 42.30 | 1.72 |
7.40 | 114.85 km2 | 2,446/km2 | |
Close
Balmoral
1. Blackstaff
2. Finaghy
3. Malone
4. Musgrave
5. Upper Malone
6. Windsor
Castle
1. Bellevue
2. Castleview
3. Cavehill
4. Chichester Park
5. Duncairn
6. Fortwilliam
Court
1. Crumlin
2. Glencairn
3. Highfield
4. Shankill
5. Woodvale
Laganbank
1. Ballynafeigh
2. Botanic
3. Rosetta
4. Shaftesbury
5. Stranmillis
Lower Falls
1. Beechmount
2. Clonard
3. Falls
4. Upper Springfield
5. Whiterock
Oldpark
1. Ardoyne
2. Ballysillan
3. Cliftonville
4. Legoniel
5. New Lodge
6. Water Works
Pottinger
1. Ballymacarrett
2. Bloomfield
3. Orangefield
4. Ravenhill
5. The Mount
6. Woodstock
Upper Falls
1. Andersonstown
2. Falls Park
3. Glen Road
4. Glencolin
5. Ladybrook
Victoria
1. Ballyhackamore
2. Belmont
3. Cherryvalley
4. Island
5. Knock
6. Stormont
7. Sydenham
1973 to 1985
More information Ward, Boundaries ...
| Ward | Electoral area | Boundaries | Population (1971)[55]
| Population (1981)[56] | Westminster constituency(s) |
| Rosetta | A | Upper Ormeau Road and Rosetta areas | 7,633 | 6,628 | |
| Ballynafeigh | A | Ballynafeigh | 6,674 | 5,231 | |
| Ormeau | A | Areas around Ravenhill Road from Park Road to Albert Bridge Road | 6,710 | 4,718 | |
| Willowfield | A | Areas bordering Woodstock and Cregagh Roads to city boundary | 7,417 | 6,292 | |
| Orangefield | A | Orangefield | 7,921 | 6,801 | |
| The Mount | A | Bordered by Ravenhill Rd, My Lady's Rd, Willowfield St, Clara St, Beersbridge Rd, Connswater and Albertbridge Rd | 8,765 | 4,640 | |
| Ballymacarrett | A | Areas between Newtownards Rd and Albertbridge Rd | 8,743 | 4,472 | |
| Island | B | Areas north of Newtownards Rd and between rivers Connswater and Lagan | 8,665 | 4,100 | |
| Sydenham | B | Bordered by Connswater, Newtownards Rd, Holywood Rd and Belfast Rd | 7,931 | 6,606 | |
| Belmont | B | Bordered by Holywood Rd, Belmont Rd and city boundary | 8,948 | 7,825 | |
| Bloomfield | B | Bordered by Bloomfield walkway, Connswater, Abetta Parade, Dunraven Gardens, North Rd and Grand Parade | 6,455 | 5,510 | |
| Ballyhackamore | B | Bordered by Bloomfield walkway, Belmont Road, Belmont Church Rd, Knock Parkand area north of Orangefield Rd and Sandhill Gardens | 7,493 | 6,434 | |
| Shandon | B | Knock, Shandon and Cherryvalley areas | 8,715 | 7,985 | |
| Stormont | B | Areas north of Upper Newtownards Rd, east of Belmont Church Rd and south and east of Belmont Road | 8,778 | 7,675 | |
| Finaghy | C | Finaghy | 7,376 | 6,599 | |
| Upper Malone | C | Upper Malone and Taughmonagh areas | 7,920 | 7,038 | |
| Malone | C | areas around Malone Road | 6,775 | 6,462 | |
| Windsor | C | Windsor | 9,925 | 6,600 | |
| Stranmillis | C | Stranmillis | 7939 | 6541 | |
| University | C | Areas around Queen's University and Lower Ormeau Road | 7,830 | 4,609 | |
| Saint James | D | Beechmount and Saint James areas | 9,202 | 8,043 | |
| Whiterock | D | | 10,861 | 6,847 | |
| Milltown | D | areas around Milltown Cemetery and Falls Park | 9,864 | 7,291 | |
| Andersonstown | D | Andersonstown and Glen Road areas | 8,433 | 6,406 | |
| Suffolk | D | Glencolin and Suffolk areas | 11,031 | 9,396 | |
| Ladybrook | D | | 11,044 | 10,085 | |
| Legoniel | E | | 7,218 | 5,504 | |
| Ballysillan | E | Ballysillan | 8,181 | 5,967 | |
| Ardoyne | E | Ardoyne and Glenbryn areas | 9,547 | 5,902 | |
| Ballygomartin | E | Ballygomartin and Glencairn areas | 7,734 | 8,467 | |
| Highfield | E | Highfield | 8,516 | 5,703 | |
| Woodvale | E | Woodvale | 7,628 | 5,889 | |
| Falls | F | Lower Falls Road around Divis tower | 5,655 | 2,645 | |
| Clonard | F | Clonard | 8,491 | 5,463 | |
| Grosvenor | F | Areas around Grosvenor Road | 7,385 | 2,239 | |
| Donegall | F | Areas currently between Westlink and Railway line, southern boundary Stockman's Lane | 7,789 | 6,227 | |
| Saint Georges | F | Sandy Row and The Village | 7,690 | 2,931 | |
| Cromac | F | Donegall Pass and The Markets | 6,991 | 2,446 | |
| New Lodge | G | Bordered by Antrim Road, Duncairn Gardens, North Queen Street and Clifton Street | 8,090 | 5,097 | |
| Central | G | Barrack St and John St, Brown Square, City Centre, Docks including all areas between Motorway and Belfast Lough, Henry St and Lancaster St areas, Smithfield, Unity Flats | 7,085 | 2,132 | |
| Shankill | G | Areas between Shankill and Crumlin Roads, east of Cambrai St as far as western half of Crimea St | 8,337 | 5,811 | |
| Crumlin | G | Bounded by Flax St, Ardoyne Ave, Oldpark Ave, Cliftonville Rd, Antrim Rd and Crumlin Rd | 12,414 | 3,250 | |
| Court | G | From Carlisle Circus, down the Westlink, up Divis Street, along Northumberland Street, the Shankill Road, Crimea Street and then down the Crumlin Road to Carlisle Circus | 7,345 | 3,325 | |
| North Howard | G | Starting from the Falls Rd, along North Howard St, Cupar Way and Lanark Way, down the Shankill Rd and along Northumberland St and the Falls Rd | 6,957 | 1,883 | |
| Bellevue | H | Bellevue | 7,530 | 6,256 | |
| Castleview | H | Innisfayle, Downview and Parkmount areas | 7,653 | 6,766 | |
| Grove | H | Areas from Skegoniell Avenue to Mountcollyer Street and Lower Cavehill Road to Kansas Avenue | 6,230 | 4,635 | |
| Duncairn | H | Tiger's Bay and Newington | 8,408 | 4,196 | |
| Fortwilliam | H | Fortwilliam | 6,690 | 5,879 | |
| Cavehill | H | Cavehill Road and areas to Kansas Avenue | 8,430 | 8,239 | |
| Cliftonville | H | Cliftonville, Torrens and Brookvale areas | 9,637 | 7,537 | |
|
Close
.png)


 Balmoral
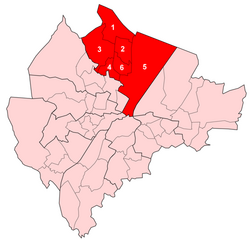 Castle
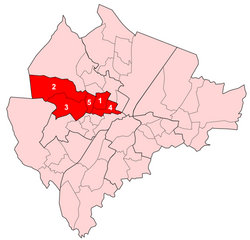 Court
Court Laganbank
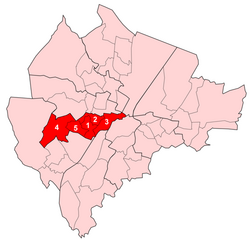 Lower Falls
 Oldpark
 Pottinger
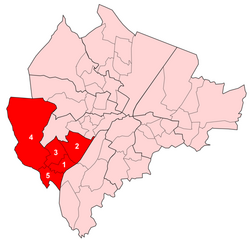 Upper Falls
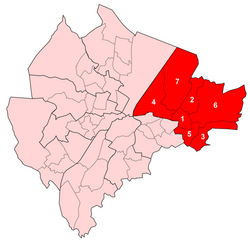 Victoria


