No coordinates found
Isoquant
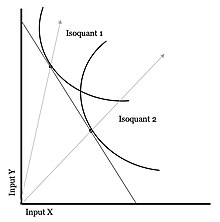
Contour line in microeconomicsAn isoquant, in microeconomics, is a contour line drawn through the set of points at which the same quantity of output is produced while changing the quantities of two or more inputs. The x and y axis on an isoquant represent two relevant inputs, which are usually a factor of production such as labour, capital, land, or organisation. An isoquant may also be known as an "iso-product curve", or an "equal product curve".
Read article
Top Questions
AI generatedMore questions


