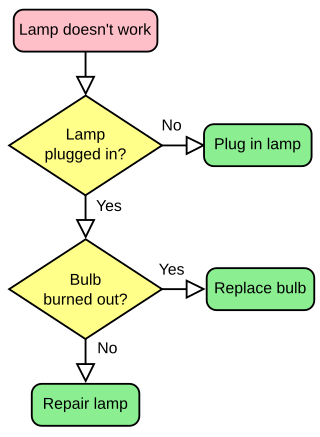
Flow chart
diagram that represents a workflow or process From Wikipedia, the free encyclopedia
Remove ads
A flow chart, also known as a flowchart, is a type of diagram, made of boxes and arrows. It can be used to show:
- An algorithm, a step-by-step list of directions that need to be followed to solve a problem
- A process, a series of stages in time where the last stage is the product, result or goal.
- The planned stages of a project.

The flow chart uses boxes, arrows and other elements:
Remove ads
Flowchart building blocks
Common Shapes
The following table shows some of the most common shapes used in flowcharts. Generally, flowcharts are read from top to bottom and left to right. Reading flowcharts can also be called "flowing".
Remove ads
Software

There are many different types of software that deal with making flowcharts. Some types of software allow users to design flowcharts that can be used to help them design a program easier. Other applications can also create programs based on the flowchart that the user designed. Some software that deal with making flowcharts include diagrams.net, Google Drawings, LibreOffice Draw, Microsoft Visio, yEd, and Inkscape.
Remove ads
Related pages
Wikimedia Commons has media related to Flow chart.
References
Wikiwand - on
Seamless Wikipedia browsing. On steroids.
Remove ads


