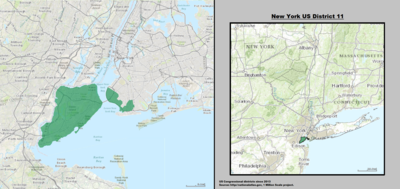
More information Election results from presidential races, Year ...
Close
More information 1996 election, Party ...
| 1996 election |
| Party |
Candidate |
Votes |
% |
±% |
|
Democratic |
Major Owens |
89,905 |
92.0 |
|
|
Republican |
Claudette Hayle |
7,866 |
8.0 |
|
| Majority |
82,039 |
83.9 |
|
| Turnout |
97,771 |
|
|
Close
More information 1998 election, Party ...
| 1998 election |
| Party |
Candidate |
Votes |
% |
±% |
|
Democratic |
Major Owens |
75,773 |
90.0 |
-2.0 |
|
Republican |
David Greene |
7,284 |
8.7 |
+0.7 |
|
Independence |
Phyllis Taliaferro |
1,144 |
1.4 |
+1.4 |
| Majority |
68,489 |
81.3 |
-2.6 |
| Turnout |
84,201 |
|
-13.9 |
Close
More information 2000 election, Party ...
| 2000 election |
| Party |
Candidate |
Votes |
% |
±% |
|
Democratic |
Major Owens |
112,050 |
87.0 |
-3.0 |
|
Republican |
Susan Cleary |
8,406 |
6.5 |
-2.2 |
|
Liberal |
Una S.T. Clarke |
7,366 |
5.7 |
+5.7 |
|
Conservative |
Cartrell Gore |
962 |
0.7 |
+0.7 |
| Majority |
103,644 |
80.5 |
-0.8 |
| Turnout |
128,784 |
|
+52.9 |
Close
More information 2002 election, Party ...
| 2002 election |
| Party |
Candidate |
Votes |
% |
±% |
|
Democratic |
Major Owens |
76,917 |
86.6 |
-0.4 |
|
Republican |
Susan Cleary |
11,149 |
12.5 |
+6.0 |
|
Conservative |
Alice Gaffney |
798 |
0.9 |
+0.2 |
| Majority |
65,768 |
74.0 |
-6.5 |
| Turnout |
88,864 |
|
-31.0 |
Close
More information 2004 election, Party ...
| 2004 election |
| Party |
Candidate |
Votes |
% |
±% |
|
Democratic |
Major Owens |
144,999 |
94.0 |
+7.4 |
|
Independence |
Lorraine Stevens |
4,721 |
3.1 |
+3.1 |
|
Conservative |
Sol Lieberman |
4,478 |
2.9 |
+2.0 |
| Majority |
140,278 |
91.0 |
+17.0 |
| Turnout |
154,198 |
|
+73.5 |
Close
More information 2006 election, Party ...
Close
More information 2008 election, Party ...
Close
More information 2010 election, Party ...
Close
More information 2015 special election, Party ...
| 2015 special election |
| Party |
Candidate |
Votes |
% |
±% |
|
Republican |
Daniel M. Donovan |
23,409 |
58.7 |
|
|
Democratic |
Vincent Gentile |
15,808 |
39.4 |
|
| Turnout |
42,569 |
|
|
Close
More information 2016 election, Party ...
| 2016 election |
| Party |
Candidate |
Votes |
% |
±% |
|
Republican |
Daniel M. Donovan |
134,366 |
62.2 |
|
|
Democratic |
Richard Reichard |
78,066 |
36.1 |
|
| Turnout |
216,023 |
|
|
Close
More information 2018 election, Party ...
Close
More information 2020 election, Party ...
Close

