File:2017-_Donald_Trump_-_graph_-_false_or_misleading_claims.png
维基百科,自由的 encyclopedia
原始文件 (2,332 × 2,657像素,文件大小:597 KB,MIME类型:image/png)

|
此graph图片可使用矢量图形重新创建为SVG文件。这具有很多好处;更多信息请参见共享资源:待清理媒体。如果存在此图片的SVG格式,请将其上传,然后将此模板替换为
{{vector version available|新图片名称}}。
建议您将SVG命名为“2017- Donald Trump - graph - false or misleading claims.svg”,这样在使用Vector version available(或Vva)模板时就不需要填写新图片名称参数。 |
摘要
| 描述2017- Donald Trump - graph - false or misleading claims.png |
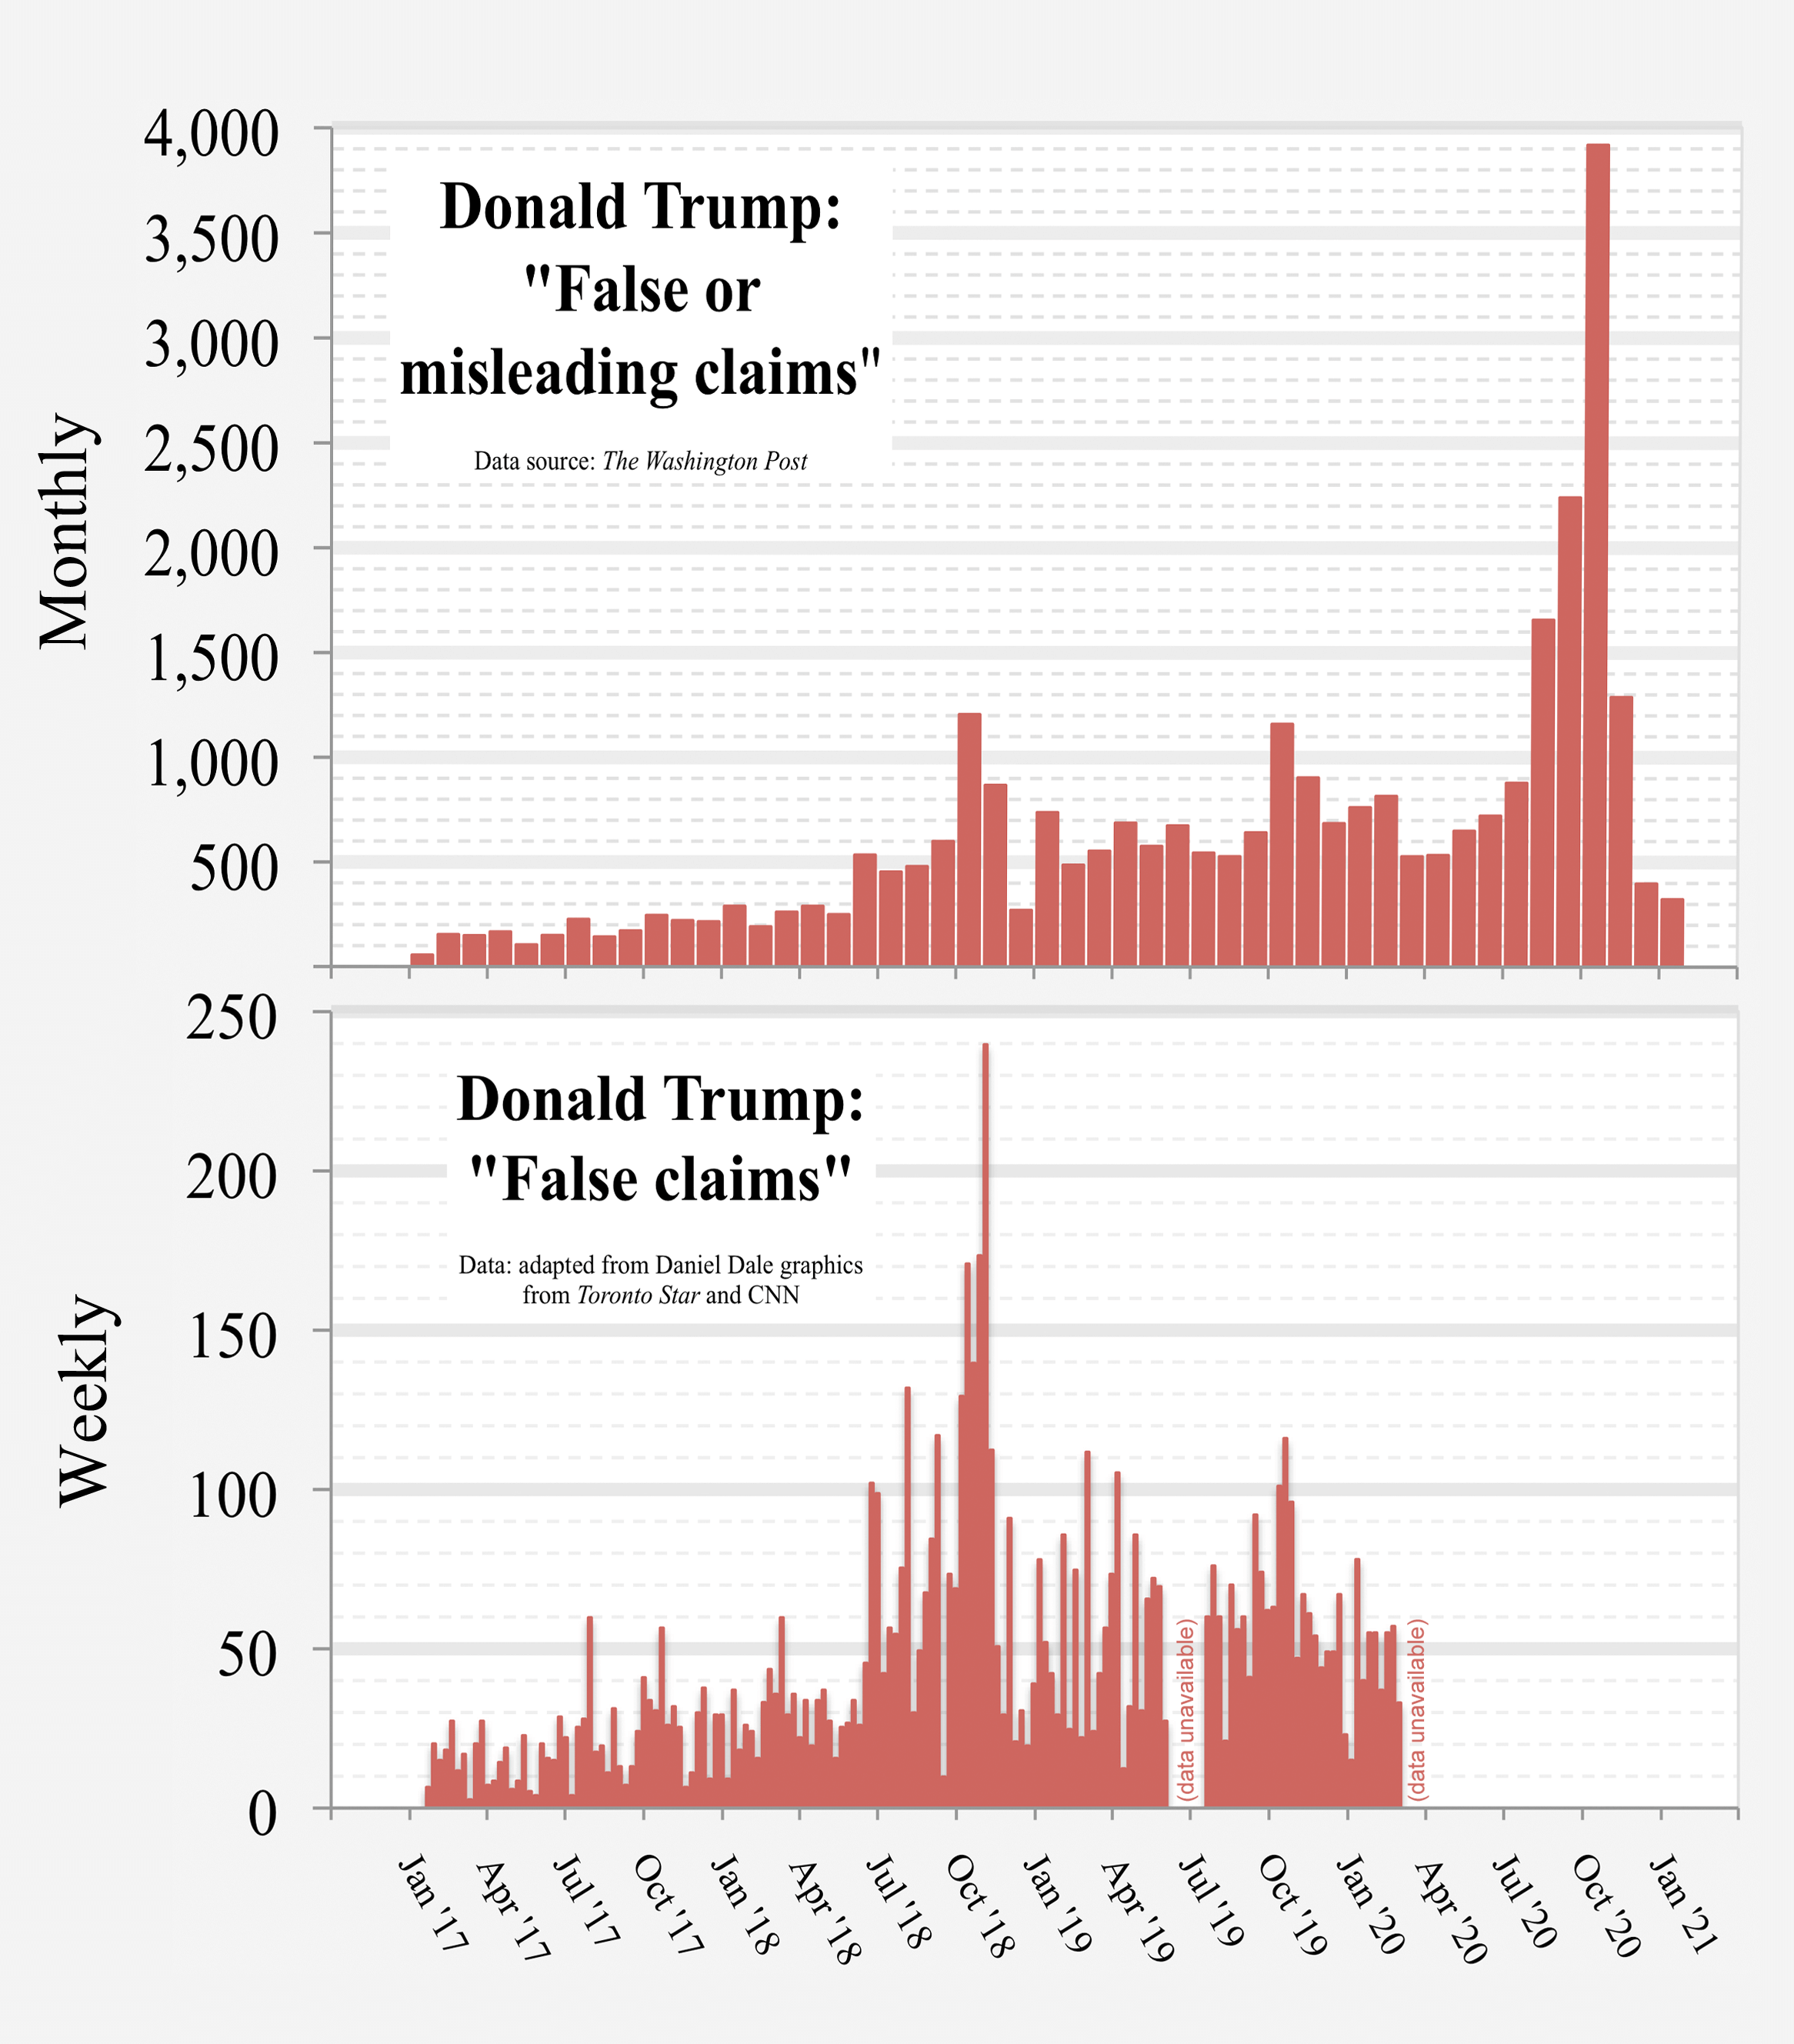
English: Charts showing findings of two newspapers' fact checkers re the number of "false or misleading" or "false" claims by U.S. President Donald Trump.
Data:
|
| 日期 | |
| 来源 | 自己的作品 |
| 作者 | RCraig09 |
| 其他版本 |
 Consolidated data into a single graph |
Data used to form the charts
Washington Post
| Click at right to show/hide The Washington Post data |
|---|
|
The Washington Post data:
|
Toronto Star and CNN data =
| Click at right to show/hide data adapted from Toronto Star and CNN graphics |
|---|
|
Data adapted by uploader from a Toronto Star graphic (is not the original data used to generate the newspaper's graphic): Week False claims (data unavailable for June and early July) 2019-07-19 60 (CNN source was dated March 9, 2020) Daniel Dale's (CNN) original source specified numbers daily; uploader added the values within each week to arrive at the foregoing weekly figures, with each week ending on a Friday to conform to Dale's earlier work at Toronto Star which also ended on Fridays.
|
许可协议
- 您可以自由地:
- 共享 – 复制、发行并传播本作品
- 修改 – 改编作品
- 惟须遵守下列条件:
- 署名 – 您必须对作品进行署名,提供授权条款的链接,并说明是否对原始内容进行了更改。您可以用任何合理的方式来署名,但不得以任何方式表明许可人认可您或您的使用。
- 相同方式共享 – 如果您再混合、转换或者基于本作品进行创作,您必须以与原先许可协议相同或相兼容的许可协议分发您贡献的作品。
说明
知识共享署名-相同方式共享4.0国际 简体中文(已转写)
5 11 2019
媒体类型 简体中文(已转写)
image/png
数据大小 简体中文(已转写)
611,681 字节
2,657 像素
2,332 像素
文件历史
点击某个日期/时间查看对应时刻的文件。
| 日期/时间 | 缩略图 | 大小 | 用户 | 备注 | |
|---|---|---|---|---|---|
| 当前 | 2021年2月9日 (二) 05:34 | | 2,332 × 2,657(597 KB) | RCraig09 | Version 17: updating to include data for January 2021. Squaring off tops of columns and narrowing gaps between columns. Reduced filesize at tinypng.com |
| 2021年1月16日 (六) 07:31 |  | 2,332 × 2,657(560 KB) | RCraig09 | Version 16: Adding datapoints for Nov and Dec 2020. Reducing PNG filesize at tinypng.com (reduces number of bits per pixel). | |
| 2021年1月5日 (二) 23:20 |  | 2,332 × 2,657(1.64 MB) | RCraig09 | Version 15: Update to include Washington Post date through end of October 2020. | |
| 2020年12月20日 (日) 23:20 |  | 2,332 × 2,657(1.67 MB) | RCraig09 | Version 14: Updated to include Washington Post data through end of September 2020. | |
| 2020年11月16日 (一) 07:21 |  | 2,332 × 2,657(1.66 MB) | RCraig09 | Version 13: Updating graph to include exact value for August 2020 that no longer involves extrapolation for the last four days of the month. Washington Post added a few more days to their database. | |
| 2020年10月21日 (三) 23:06 |  | 2,332 × 2,657(1.66 MB) | RCraig09 | Version 12: Updating to include July and August data from Washington Post. Top panel's vertical had to be compressed to accommodate new high in data value (for August 2020). | |
| 2020年7月13日 (一) 06:01 |  | 2,332 × 2,657(1.43 MB) | RCraig09 | Update to include Washington Post data through end of June 2020. | |
| 2020年6月5日 (五) 05:09 |  | 2,332 × 2,657(1.49 MB) | RCraig09 | Version 10: Update to include Washington Post data for April and May 2020 | |
| 2020年4月15日 (三) 21:12 |  | 2,332 × 2,657(1.77 MB) | RCraig09 | Version 9: Updating with CNN Daniel Dale data for Jan and Feb 2020. | |
| 2020年4月15日 (三) 05:35 |  | 2,332 × 2,657(1.83 MB) | RCraig09 | Version 8: Adding "monthly" and "weekly" to vertical axes. |
文件用途
以下页面使用本文件:
全域文件用途
以下其他wiki使用此文件:
- en.wikipedia.org上的用途
- es.wikipedia.org上的用途
- fa.wikipedia.org上的用途
- ru.wikipedia.org上的用途
- vi.wikipedia.org上的用途