File:Normal_distribution_and_scales.gif
維基百科,自由的 encyclopedia
預覽大小:800 × 458 像素。 其他解析度:320 × 183 像素 | 640 × 366 像素 | 1,200 × 687 像素。
原始檔案 (1,200 × 687 像素,檔案大小:39 KB,MIME 類型:image/gif)

|
File:The Normal Distribution.svg是本檔案的向量版本。 請優先使用那個圖片而非本點陣圖片。
File:Normal distribution and scales.gif → File:The Normal Distribution.svg
更多資訊請參閱Help:SVG/zh。
|
 |
Transferred from en.wikipedia to Commons by Maksim.
The original description page was here. All following user names refer to en.wikipedia.
摘要
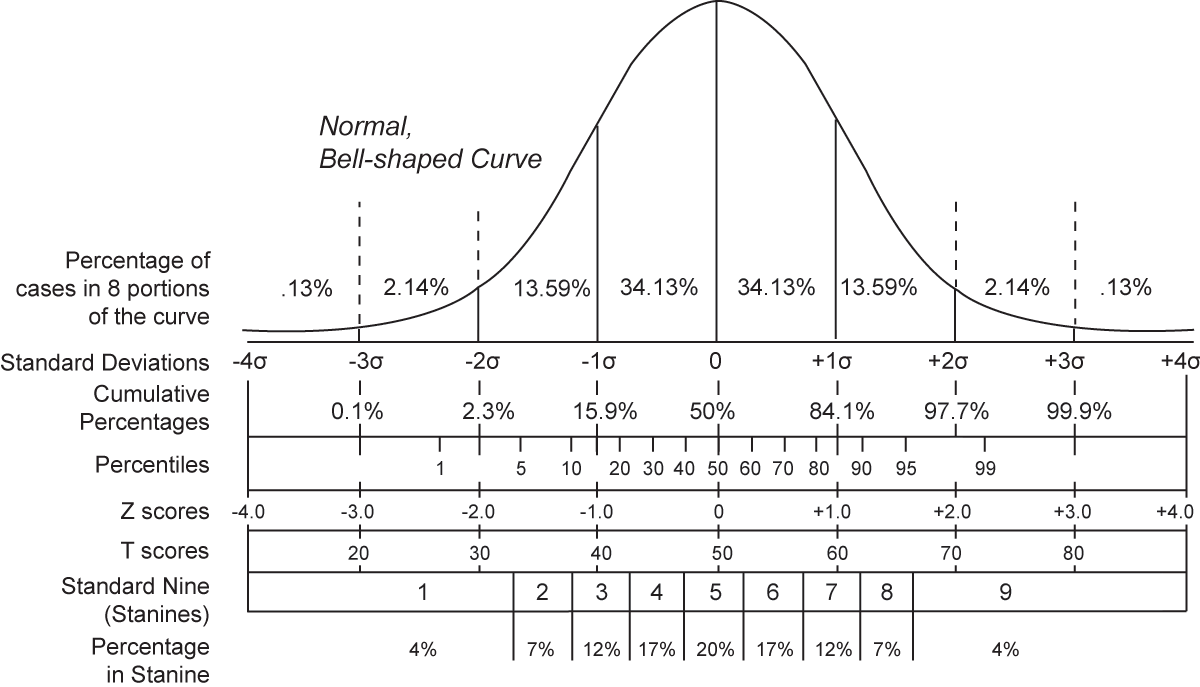
A chart comparing the various grading methods in a normal distribution. Includes: Standard deviations, cumulative percentages, percentile equivalents, Z-scores, T-scores, standard nine, percentage in stanine. Inspired by Figure 4.3 on Page 74 of Ward, A. W., Murray-Ward, M. (1999). Assessment in the Classroom. Belmont, CA: Wadsworth. ISBN 0534527043
授權條款
| Public domainPublic domainfalsefalse |
| 我,此作品的版權所有人,釋出此作品至公共領域。此授權條款在全世界均適用。 這可能在某些國家不合法,如果是的話: 我授予任何人有權利使用此作品於任何用途,除受法律約束外,不受任何限制。 |
| date/time | username | edit summary |
|---|---|---|
| 22:09, 19 December 2005 | en:User:Jeremykemp | (ISBN) |
| 22:01, 19 December 2005 | en:User:Jeremykemp | (added reference) |
| 21:53, 19 December 2005 | en:User:Jeremykemp | (A chart comparing the various grading methods in a normal distribution. Includes: Standard deviations, cummulative precentages, percentile equivalents, Z-scores, T-scores, standard nine, percent in stanine) |
原始上傳日誌
Legend: (cur) = this is the current file, (del) = delete this old version, (rev) = revert to this old version.
Click on date to download the file or see the image uploaded on that date.
- (del) (cur) 21:53, 19 December 2005 . . en:User:Jeremykemp Jeremykemp ( en:User_talk:Jeremykemp Talk) . . 1200x687 (39575 bytes) (A chart comparing the various grading methods in a normal distribution. Includes: Standard deviations, cummulative precentages, percentile equivalents, Z-scores, T-scores, standard nine, percent in stanine)
說明
添加單行說明來描述出檔案所代表的內容
在此檔案描寫的項目
描繪內容
檔案歷史
點選日期/時間以檢視該時間的檔案版本。
| 日期/時間 | 縮圖 | 尺寸 | 使用者 | 備註 | |
|---|---|---|---|---|---|
| 目前 | 2006年3月20日 (一) 18:12 | | 1,200 × 687(39 KB) | Maksim | La bildo estas kopiita de wikipedia:en. La originala priskribo estas: == Summary == A chart comparing the various grading methods in a normal distribution. Includes: Standard deviations, cummulative precentages, percentile equivalents, Z-scores, T-scores |
檔案用途
下列頁面有用到此檔案:
全域檔案使用狀況
以下其他 wiki 使用了這個檔案:
- ar.wikipedia.org 的使用狀況
- ca.wikipedia.org 的使用狀況
- de.wikipedia.org 的使用狀況
- dv.wikipedia.org 的使用狀況
- en.wikipedia.org 的使用狀況
- eo.wikipedia.org 的使用狀況
- es.wikipedia.org 的使用狀況
- fr.wikipedia.org 的使用狀況
- gl.wikipedia.org 的使用狀況
- he.wikibooks.org 的使用狀況
- he.wiktionary.org 的使用狀況
- ko.wikipedia.org 的使用狀況
- mr.wikipedia.org 的使用狀況
- mwl.wikipedia.org 的使用狀況
- pl.wikipedia.org 的使用狀況
- pl.wiktionary.org 的使用狀況
- pt.wikipedia.org 的使用狀況
- pt.wikiquote.org 的使用狀況
- ru.wikipedia.org 的使用狀況
- simple.wiktionary.org 的使用狀況
- tg.wikipedia.org 的使用狀況
- zh-min-nan.wikipedia.org 的使用狀況