Loading AI tools
Arun District Council in West Sussex, England is elected every four years. Since the last boundary changes in 2015, 54 councillors have been elected from 23 wards.
- 1973 Arun District Council election
- 1976 Arun District Council election
- 1979 Arun District Council election
- 1983 Arun District Council election (New ward boundaries)[1]
- 1987 Arun District Council election (District boundary changes took place but the number of seats remained the same)[2][3]
- 1991 Arun District Council election
- 1995 Arun District Council election
- 1999 Arun District Council election
- 2003 Arun District Council election (New ward boundaries)[4][5]
- 2007 Arun District Council election
- 2011 Arun District Council election
- 2015 Arun District Council election (New ward boundaries)[6]
- 2019 Arun District Council election
- 2023 Arun District Council election
Overview
Election results
| Year | Conservative | Liberal Democrats | Labour | UKIP | Independents | Majority | Notes | ||||||
| 1973[7] | 39 | 4 | 4 | 0 | 13 | Con Maj 18 | First elections to Council, formed of 60 seats | ||||||
| 1976 | 50 | 5 | 1 | 0 | 4 | Con Maj 40 | |||||||
| 1979 | 50 | 9 | 1 | 0 | 0 | Con Maj 40 | |||||||
| 1983 | 51 | 4 | 1 | 0 | 0 | Con Maj 46 | Boundary changes reduce size of council to 56 | ||||||
| 1987 | 51 | 4 | 1 | 0 | 0 | Con Maj 46 | |||||||
| 1991 | 36 | 11 | 7 | 0 | 2 | Con Maj 16 | |||||||
| 1995 | 29 | 14 | 10 | 0 | 3 | Con Maj 2 | |||||||
| 1999 | 36 | 10 | 8 | 0 | 2 | Con Maj 16 | |||||||
| 2003 | 36 | 11 | 8 | 0 | 1 | Con Maj 16 | |||||||
| 2007 | 42 | 9 | 3 | 0 | 2 | Con Maj 28 | |||||||
| 2011 | 48 | 4 | 3 | 0 | 1 | Con Maj 40 | |||||||
| 2015 | 42 | 5 | 1 | 4 | 2 | Con Maj 30 | Boundary changes reduce size of council to 54 | ||||||
| 2019 | 21 | 22 | 1 | 0 | 8 | NOC | |||||||
| 2023 | 20 | 14 | 8 | 0 | 6 | NOC | |||||||
Composition of the council
| Political party | Councillors | |||||||||||||||
|---|---|---|---|---|---|---|---|---|---|---|---|---|---|---|---|---|
| 1973 | 1976 | 1979 | 1983 | 1987 | 1991 | 1995 | 1999 | 2003 | 2007 | 2011 | 2015 | 2019 | 2023 | |||
| Conservative | 39 | 50 | 50 | 51 | 51 | 36 | 29 | 36 | 36 | 42 | 48 | 42 | 21 | 20 / 54 |
||
| Liberal Democrat | 4 | 5 | 9 | 4 | 4 | 11 | 14 | 10 | 11 | 9 | 4 | 5 | 22 | 14 / 54 |
||
| Labour | 4 | 1 | 1 | 1 | 1 | 7 | 10 | 8 | 8 | 3 | 3 | 1 | 1 | 8 / 54 |
||
| Green | 0 | 0 | 0 | 0 | 0 | 0 | 0 | 0 | 0 | 0 | 0 | 0 | 2 | 6 / 54 |
||
| Independent | 13 | 4 | 0 | 0 | 0 | 2 | 3 | 2 | 1 | 2 | 1 | 2 | 8 | 6 / 54 |
||
| UKIP | 0 | 0 | 0 | 0 | 0 | 0 | 0 | 0 | 0 | 0 | 0 | 4 | 0 | 0 / 54 |
||
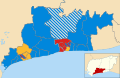 2003 results map
 2007 results map
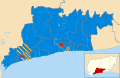 2011 results map
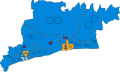 2015 results map
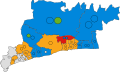 2019 results map
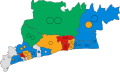 2023 results map


Overview
| By-election | Date | Incumbent party | Result | ||
|---|---|---|---|---|---|
| Rustington South | 26 March 1998 | Conservative | Conservative | ||
| Felpham | 3 December 1998 | Independent | Conservative | ||
| Rustington South | 15 July 1999 | Conservative | Conservative | ||
| Hotham | 27 July 2000 | Conservative | Conservative | ||
| Yapton | 5 May 2005 | Conservative | Liberal Democrats | ||
| Felpham East | 22 September 2005 | Conservative | Conservative | ||
| Angmering | 10 November 2005 | Conservative | Conservative | ||
| Rustington West | 20 April 2006 | Conservative | Conservative | ||
| Angmering | 1 June 2006 | Conservative | Conservative | ||
| Yapton | 1 June 2006 | Liberal Democrats | Conservative | ||
| Yapton | 20 March 2008 | Conservative | Conservative | ||
| Felpham West | 2 April 2009 | Conservative | Conservative | ||
| Aldwick East | 14 March 2013 | Conservative | Liberal Democrats | ||
| Angmering | 18 April 2013 | Conservative | Conservative | ||
| Aldwick West | 2 November 2017 | Conservative | Liberal Democrats | ||
| Marine | 22 February 2018 | Conservative | Liberal Democrats | ||
| Brookfield | 6 May 2021 | Liberal Democrats | Conservative | ||
| Pevensey | 6 May 2021 | Liberal Democrats | Conservative | ||
| Barnham | 8 September 2022 | Conservative | Green | ||
| Arundel and Walberton | 1 December 2022 | Green | Green | ||
1995-1999
| Party | Candidate | Votes | % | ±% | |
|---|---|---|---|---|---|
| Conservative | 594 | 60.4 | |||
| Liberal Democrats | 374 | 38.6 | |||
| Majority | 220 | 22.8 | |||
| Turnout | 968 | 31.0 | |||
| Conservative hold | Swing | ||||
| Party | Candidate | Votes | % | ±% | |
|---|---|---|---|---|---|
| Conservative | 393 | 40.1 | +9.6 | ||
| Independent | 294 | 30.0 | +8.8 | ||
| Liberal Democrats | 167 | 17.0 | +9.4 | ||
| Independent | 102 | 10.4 | +10.4 | ||
| Labour | 24 | 2.5 | −6.4 | ||
| Majority | 99 | 10.1 | |||
| Turnout | 980 | 27.4 | |||
| Conservative gain from Independent | Swing | ||||
1999-2003
| Party | Candidate | Votes | % | ±% | |
|---|---|---|---|---|---|
| Conservative | Florence Harrison | 604 | 64.1 | ||
| Liberal Democrats | Richard James | 208 | 22.1 | ||
| Labour | Moira Rice | 130 | 13.8 | ||
| Majority | 396 | 42.0 | |||
| Turnout | 942 | 30.0 | |||
| Conservative hold | Swing | ||||
| Party | Candidate | Votes | % | ±% | |
|---|---|---|---|---|---|
| Conservative | Andrew Evans | 429 | 38.7 | −2.7 | |
| Labour | Pauline Nash | 388 | 35.0 | +5.6 | |
| Liberal Democrats | Sylvia Olliver | 292 | 26.3 | −3.0 | |
| Majority | 41 | 3.7 | |||
| Turnout | 1,109 | 24.4 | |||
| Conservative hold | Swing | ||||
2003-2007
| Party | Candidate | Votes | % | ±% | |
|---|---|---|---|---|---|
| Liberal Democrats | Ian Menzies | 1,213 | 50.7 | +24.3 | |
| Conservative | Richard Taft | 1,179 | 49.3 | −24.3 | |
| Majority | 34 | 1.4 | |||
| Turnout | 2,392 | 60.5 | |||
| Liberal Democrats gain from Conservative | Swing | ||||
| Party | Candidate | Votes | % | ±% | |
|---|---|---|---|---|---|
| Conservative | Paul English | 492 | 58.2 | +9.3 | |
| Liberal Democrats | Michael Harvey | 267 | 31.6 | +31.6 | |
| Labour | Simon Holland | 86 | 10.2 | −1.6 | |
| Majority | 225 | 26.6 | |||
| Turnout | 845 | 22.6 | |||
| Conservative hold | Swing | ||||
| Party | Candidate | Votes | % | ±% | |
|---|---|---|---|---|---|
| Conservative | Paul Bicknell | 846 | 66.8 | +3.4 | |
| Liberal Democrats | Trevor Richards | 421 | 33.2 | −3.4 | |
| Majority | 425 | 33.6 | |||
| Turnout | 1,267 | 22.8 | |||
| Conservative hold | Swing | ||||
| Party | Candidate | Votes | % | ±% | |
|---|---|---|---|---|---|
| Conservative | Florence Harrison | 769 | 44.1 | +1.8 | |
| Liberal Democrats | Andrew Lauretani | 581 | 33.4 | +3.0 | |
| UKIP | 277 | 15.9 | −2.1 | ||
| Labour | 115 | 6.6 | −2.7 | ||
| Majority | 188 | 10.7 | |||
| Turnout | 1,742 | 26.8 | |||
| Conservative hold | Swing | ||||
| Party | Candidate | Votes | % | ±% | |
|---|---|---|---|---|---|
| Conservative | Dudley Wensley | 1,052 | 73.6 | +6.8 | |
| Liberal Democrats | Trevor Richards | 254 | 17.8 | −15.4 | |
| Labour | 123 | 8.6 | +8.6 | ||
| Majority | 798 | 55.8 | +22.2 | ||
| Turnout | 1,429 | 24.7 | +1.9 | ||
| Conservative hold | Swing | ||||
| Party | Candidate | Votes | % | ±% | |
|---|---|---|---|---|---|
| Conservative | Michael Taft | 699 | 70.5 | +21.2 | |
| Liberal Democrats | Roslyn Kissell | 205 | 20.7 | −30.0 | |
| Labour | 87 | 8.8 | +8.8 | ||
| Majority | 494 | 49.8 | |||
| Turnout | 991 | 24.0 | −36.5 | ||
| Conservative gain from Liberal Democrats | Swing | ||||
2007-2011
| Party | Candidate | Votes | % | ±% | |
|---|---|---|---|---|---|
| Conservative | Emma Neno | 620 | 59.8 | −4.8 | |
| Liberal Democrats | David Jones | 212 | 20.4 | −2.4 | |
| BNP | Albert Bodle | 205 | 19.8 | +19.8 | |
| Majority | 408 | 39.4 | |||
| Turnout | 1,037 | 25.4 | |||
| Conservative hold | Swing | -1.2 | |||
| Party | Candidate | Votes | % | ±% | |
|---|---|---|---|---|---|
| Conservative | Gillian Madeley | 630 | 52.1 | −3.1 | |
| Liberal Democrats | Martin Lury | 269 | 22.2 | +10.3 | |
| BNP | Michael Witchell | 165 | 13.6 | +13.6 | |
| UKIP | Joan Phillips | 89 | 7.4 | −4.6 | |
| Labour | Michelle White | 56 | 4.6 | +4.6 | |
| Majority | 361 | 29.9 | N/A | ||
| Turnout | 1,209 | 30.2 | −8.5 | ||
| Conservative hold | Swing | ||||
2011-2015
| Party | Candidate | Votes | % | ±% | |
|---|---|---|---|---|---|
| Liberal Democrats | Paul Wells | 383 | 33.6 | +17.9 | |
| Conservative | Bill Smee | 357 | 31.3 | −32.6 | |
| UKIP | Janet Taylor | 339 | 29.7 | +22.6 | |
| Labour | Richard Dawson | 61 | 5.3 | −1.3 | |
| Majority | 26 | 2.3 | |||
| Turnout | 1,141 | 26.8 | −26.2 | ||
| Liberal Democrats gain from Conservative | Swing | 25.3 | |||
| Party | Candidate | Votes | % | ±% | |
|---|---|---|---|---|---|
| Conservative | Andy Cooper | 878 | 63.9 | +22.3 | |
| Labour | Carly Godwin | 268 | 19.5 | +1.5 | |
| Liberal Democrats | Jamie Bennett | 228 | 16.6 | +4.8 | |
| Majority | 610 | 34.4 | |||
| Turnout | 1,141 | 23.4 | −21.4 | ||
| Conservative hold | Swing | 10.4 | |||
2015-2019
| Party | Candidate | Votes | % | ±% | |
|---|---|---|---|---|---|
| Liberal Democrats | Martin Smith | 719 | 52.7 | +17.9 | |
| Conservative | Guy Purser | 480 | 36.2 | −32.6 | |
| Labour | Ian Manion | 112 | 8.2 | New | |
| Green | Carol Birch | 54 | 4.0 | New | |
| Majority | 239 | 17.5 | |||
| Turnout | 1,369 | 26.3 | −26.2 | ||
| Liberal Democrats gain from Conservative | Swing | 25.5 | |||
| Party | Candidate | Votes | % | ±% | |
|---|---|---|---|---|---|
| Liberal Democrats | Matt Stanley | 309 | 32.7 | New | |
| Labour | Alison Sharples | 252 | 26.7 | +7.3 | |
| Conservative | Katherine Eccles | 242 | 25.6 | −0.7 | |
| Independent | Steve Goodheart | 141 | 14.9 | New | |
| Majority | 57 | 6.0 | |||
| Turnout | 950 | 20.1 | −30.7 | ||
| Liberal Democrats gain from Conservative | Swing | 16.7 | |||
2019-2023
| Party | Candidate | Votes | % | ±% | |
|---|---|---|---|---|---|
| Conservative | David Chace | 680 | 48.5 | +17.7 | |
| Liberal Democrats | Roberta Woodman | 526 | 37.5 | −21.0 | |
| Labour | Freddie Tandy | 152 | 10.8 | +0.1 | |
| Workers Party | Jonathan Maxted | 45 | 3.2 | New | |
| Majority | 154 | 11.0 | |||
| Turnout | 1,411 | 29.6 | +1.1 | ||
| Conservative gain from Liberal Democrats | Swing | 19.4 | |||
| Party | Candidate | Votes | % | ±% | |
|---|---|---|---|---|---|
| Conservative | Joan English | 357 | 38.3 | +16.4 | |
| Liberal Democrats | John Barrett | 210 | 22.5 | −6.9 | |
| Labour | Simon McDougall | 140 | 15.0 | −0.6 | |
| Independent | Jan Cosgrove | 132 | 14.2 | New | |
| Green | Carol Birch | 93 | 10.0 | New | |
| Majority | 147 | 15.8 | |||
| Turnout | 947 | 22.4 | −3.3 | ||
| Conservative gain from Liberal Democrats | Swing | 11.7 | |||
| Party | Candidate | Votes | % | ±% | |
|---|---|---|---|---|---|
| Green | Sue Wallsgrove | 786 | 50.9 | +6.8 | |
| Conservative | Graham Jones | 641 | 41.5 | −8.6 | |
| Labour | Alan Butcher | 116 | 7.5 | −14.0 | |
| Majority | 145 | 9.4 | |||
| Turnout | 1,547 | 21.3 | −7.6 | ||
| Green gain from Conservative | Swing | ||||
Wikiwand in your browser!
Seamless Wikipedia browsing. On steroids.
Every time you click a link to Wikipedia, Wiktionary or Wikiquote in your browser's search results, it will show the modern Wikiwand interface.
Wikiwand extension is a five stars, simple, with minimum permission required to keep your browsing private, safe and transparent.