Loading AI tools
Erewash Borough Council elections are held every four years. Erewash Borough Council is the local authority for the non-metropolitan district of Erewash in Derbyshire, England. Since the last boundary changes in 2015, 47 councillors are elected from 19 wards.[1]
- 1973 Erewash District Council election
- 1976 Erewash Borough Council election
- 1979 Erewash Borough Council election (New ward boundaries)[2]
- 1983 Erewash Borough Council election
- 1987 Erewash Borough Council election (Borough boundary changes took place but the number of seats remained the same)[3]
- 1991 Erewash Borough Council election
- 1995 Erewash Borough Council election (Borough boundary changes took place but the number of seats remained the same)[4]
- 1999 Erewash Borough Council election
- 2003 Erewash Borough Council election (New ward boundaries reduced the number of seats by 1)[5][6]
- 2007 Erewash Borough Council election
- 2011 Erewash Borough Council election
- 2015 Erewash Borough Council election (New ward boundaries)[1]
- 2019 Erewash Borough Council election
- 2023 Erewash Borough Council election
| Year | Conservative | Labour | Liberal Democrats | Liberal | Green | Independent | Control |
|---|---|---|---|---|---|---|---|
| 1973 | 9 | 36 | - | 5 | - | 4 | Labour |
| 1976 | 37 | 4 | - | 5 | - | 8[lower-alpha 1] | Conservative |
| 1979 | 30 | 17 | - | 1 | - | 3[lower-alpha 2] | Conservative |
| 1983 | 28 | 20 | - | 0 | - | 3[lower-alpha 3] | Conservative |
| 1987 | 29 | 21 | - | 0 | - | 2 | Conservative |
| 1991 | 22 | 27 | 1 | - | 0 | 2 | Labour |
| 1995 | 8 | 40 | 2 | - | 0 | 2 | Labour |
| 1999 | 15 | 29 | 4 | - | 0 | 4 | Labour |
| 2003 | 26 | 19 | 4 | - | 0 | 2 | Conservative |
| 2007 | 30 | 18 | 2 | - | 0 | 1 | Conservative |
| 2011 | 26 | 25 | 0 | - | 0 | 0 | Conservative |
| 2015 | 30 | 17 | 0 | - | 0 | 0 | Conservative |
| 2019 | 27 | 19 | 1 | - | 0 | 0 | Conservative |
| 2023 | 16 | 28 | 1 | - | 1 | 1 | Labour |
 2015 results map
 2019 results map
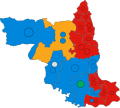 2023 results map


1995-1999
| Party | Candidate | Votes | % | ±% | |
|---|---|---|---|---|---|
| Labour | 331 | 71.6 | −11.2 | ||
| Conservative | 97 | 21.0 | +3.7 | ||
| Liberal Democrats | 34 | 7.4 | +7.4 | ||
| Majority | 234 | 50.6 | |||
| Turnout | 462 | ||||
| Labour hold | Swing | ||||
| Party | Candidate | Votes | % | ±% | |
|---|---|---|---|---|---|
| Liberal Democrats | 704 | 60.6 | +23.4 | ||
| Conservative | 308 | 26.5 | −2.4 | ||
| Labour | 150 | 12.9 | −21.1 | ||
| Majority | 396 | 34.1 | |||
| Turnout | 1,162 | ||||
| Liberal Democrats hold | Swing | ||||
| Party | Candidate | Votes | % | ±% | |
|---|---|---|---|---|---|
| Liberal Democrats | 733 | 48.4 | +29.1 | ||
| Conservative | 402 | 26.5 | +14.4 | ||
| Labour | 380 | 25.1 | +6.6 | ||
| Majority | 331 | 21.9 | |||
| Turnout | 1,515 | 28.8 | |||
| Liberal Democrats gain from Conservative | Swing | ||||
1999-2003
| Party | Candidate | Votes | % | ±% | |
|---|---|---|---|---|---|
| Conservative | 432 | 43.2 | +8.8 | ||
| Liberal Democrats | 416 | 41.6 | −3.6 | ||
| Labour | 151 | 15.1 | −5.3 | ||
| Majority | 16 | 1.6 | |||
| Turnout | 999 | 30.1 | |||
| Conservative gain from Liberal Democrats | Swing | ||||
| Party | Candidate | Votes | % | ±% | |
|---|---|---|---|---|---|
| Conservative | 433 | 46.6 | −6.0 | ||
| Liberal Democrats | 375 | 40.3 | +27.4 | ||
| Labour | 122 | 13.1 | −21.5 | ||
| Majority | 58 | 6.3 | |||
| Turnout | 930 | 24.0 | |||
| Conservative hold | Swing | ||||
| Party | Candidate | Votes | % | ±% | |
|---|---|---|---|---|---|
| Labour | 294 | 42.1 | −20.6 | ||
| Independent | 205 | 29.4 | +29.4 | ||
| Conservative | 199 | 28.5 | −8.8 | ||
| Majority | 89 | 12.7 | |||
| Turnout | 698 | 17.9 | |||
| Labour hold | Swing | ||||
2003-2007
| Party | Candidate | Votes | % | ±% | |
|---|---|---|---|---|---|
| Conservative | 627 | 63.0 | +17.1 | ||
| Liberal Democrats | 368 | 37.0 | +0.9 | ||
| Majority | 259 | 26.0 | |||
| Turnout | 995 | 35.2 | |||
| Conservative hold | Swing | ||||
| Party | Candidate | Votes | % | ±% | |
|---|---|---|---|---|---|
| Labour | Louis Booth | 523 | 52.1 | +23.4 | |
| Liberal Democrats | 232 | 23.1 | −1.5 | ||
| Conservative | 120 | 11.9 | −1.4 | ||
| UKIP | 129 | 12.8 | +12.8 | ||
| Majority | 291 | 29.0 | |||
| Turnout | 1,004 | 21.2 | |||
| Labour hold | Swing | ||||
| Party | Candidate | Votes | % | ±% | |
|---|---|---|---|---|---|
| Conservative | 423 | 38.1 | +29.4 | ||
| Labour | 348 | 31.4 | +21.4 | ||
| Liberal Democrats | 338 | 30.5 | +0.0 | ||
| Majority | 75 | 6.7 | |||
| Turnout | 1,109 | 21.7 | |||
| Conservative gain from Liberal Democrats | Swing | ||||
| Party | Candidate | Votes | % | ±% | |
|---|---|---|---|---|---|
| Labour | 707 | 77.0 | +24.9 | ||
| Conservative | 132 | 14.4 | +2.5 | ||
| Liberal Democrats | 79 | 8.6 | −14.5 | ||
| Majority | 575 | 62.6 | |||
| Turnout | 918 | 19.3 | |||
| Labour gain from Independent | Swing | ||||
2007-2011
| Party | Candidate | Votes | % | ±% | |
|---|---|---|---|---|---|
| Labour | Keri Andrews | 696 | 39.0 | +6.7 | |
| Conservative | Elaine Wright | 584 | 32.7 | −12.7 | |
| Liberal Democrats | Ian Neil | 301 | 16.9 | −5.4 | |
| BNP | Mark Bailey | 205 | 11.5 | +11.5 | |
| Majority | 112 | 6.3 | |||
| Turnout | 1,786 | ||||
| Labour gain from Conservative | Swing | ||||
| Party | Candidate | Votes | % | ±% | |
|---|---|---|---|---|---|
| Conservative | Kathryn Major | 471 | 53.4 | +2.1 | |
| Labour | James Dawson | 306 | 34.7 | −14.0 | |
| Liberal Democrats | Peter Aanonson | 105 | 11.9 | +11.9 | |
| Majority | 165 | 18.7 | |||
| Turnout | 882 | 23.0 | |||
| Conservative hold | Swing | ||||
| Party | Candidate | Votes | % | ±% | |
|---|---|---|---|---|---|
| Conservative | Bruce Broughton | 692 | 51.4 | −22.6 | |
| Liberal Democrats | Gary Hamson | 506 | 37.6 | +37.6 | |
| Labour | James Dawson | 149 | 11.1 | −15.0 | |
| Majority | 186 | 13.8 | |||
| Turnout | 1,347 | 33.8 | |||
| Conservative hold | Swing | ||||
2019-2023
| Party | Candidate | Votes | % | ±% | |
|---|---|---|---|---|---|
| Conservative | Jon Wright | 683 | 54.1 | ||
| Labour | Jo Ward | 507 | 40.1 | ||
| Liberal Democrats | Angela Togni | 73 | 5.8 | ||
| Majority | 176 | 13.9 | |||
| Turnout | 1,263 | ||||
| Conservative gain from Labour | Swing | ||||
| Party | Candidate | Votes | % | ±% | |
|---|---|---|---|---|---|
| Conservative | Bryn Lewis | 707 | 51.5 | ||
| Labour | Adam Thompson | 509 | 37.1 | ||
| Green | Lee Fletcher | 110 | 8.0 | ||
| Liberal Democrats | Rodney Allen | 47 | 3.4 | ||
| Majority | 198 | 14.4 | |||
| Turnout | 1,373 | ||||
| Conservative gain from Labour | Swing | ||||
Wikiwand in your browser!
Seamless Wikipedia browsing. On steroids.
Every time you click a link to Wikipedia, Wiktionary or Wikiquote in your browser's search results, it will show the modern Wikiwand interface.
Wikiwand extension is a five stars, simple, with minimum permission required to keep your browsing private, safe and transparent.