File:Carbon_cycle-cute_diagram.svg
From Wikipedia, the free encyclopedia

Size of this PNG preview of this SVG file: 600 × 460 pixels. Other resolutions: 313 × 240 pixels | 626 × 480 pixels | 1,002 × 768 pixels | 1,280 × 981 pixels | 2,560 × 1,963 pixels.
Original file (SVG file, nominally 600 × 460 pixels, file size: 65 KB)
| This is a file from the Wikimedia Commons. Information from its description page there is shown below. Commons is a freely licensed media file repository. You can help. |
| Please do not upload a version translated with the buggy SVG Translate without first cleaning it from all the garbage the tool adds! |
Summary
| DescriptionCarbon cycle-cute diagram.svg |
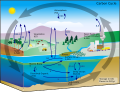
Deutsch: Diagramm des Kohlenstoffkreislaufes. Die schwarzen Zahlen zeigen wie viele Milliarden Tonnen Kohlenstoff (Gt C) in den verschiedenen Resevoiren vorhanden sind. Die blauen Zahlen zeigen an, wie viel Kohlenstoff zwischen den einzelnen Speichern pro Jahr ausgetauscht wird.
English: This carbon cycle diagram shows the storage and annual exchange of carbon between the atmosphere, hydrosphere and geosphere in gigatons - or billions of tons - of Carbon (GtC). Burning fossil fuels by people adds about 5.5 GtC of carbon per year into the atmosphere.
Español: Este esquema del ciclo del carbono muestra el almacenamiento y los cambios anuales del s entre la atmósfera, la hidrósfera y la geósfera en gigatones, o miles de millones de toneladas, de carbono (GtC). La quema de combustibles fósiles libera cerca de 5.5 mil millones de toneladas de carbono al año en la atmósfera.
Galego: Este esquema do ciclo do carbono amosa o almacenamento e os cambios anuais do carbono entre a atmosfera, a hidrosfera e a xeosfera en xigatóns, ou miles de millóns de toneladas, de carbono (XtC). A queima de combustibles fósiles libera preto de 5.5 mil millóns de toneladas de carbono ó ano na atmosfera.
日本語: 炭素循環の概念図。黒の数値はそれぞれのリザーバーに存在する炭素量、青の数値はリザーバー間での年間の炭素の移動量。単位はギガt(10億トン)
Русский: Схема геохимического цикла углерода показывает количество углерода в атмосфере, гидросфере и геосфере Земли, а также годовой перенос углерода между ними. Все величины приведены в гигатоннах (миллиардах тонн). В результате сжигания ископаемого топлива, человечество ежегодно добавляет 5,5 гигатонн углерода в атмосферу. |
|||
| Date | ||||
| Source | Own work based on: Carbon cycle-cute diagram.jpeg (i.e. https://earthobservatory.nasa.gov/features/CarbonCycle) | |||
| Author |
Vector: |
|||
| Permission (Reusing this file) |
|
|||
| Other versions |
File:Carbon cycle-cute diagram.svg has 18 embedded translations.
[edit] Single-language versions
|
|||
| SVG development InfoField | This diagram was created with Inkscape. This diagram is translated using SVG switch elements: all translations are stored in the same file.
|


Original upload log
This image is a derivative work of the following images:
- File:Carbon cycle-cute diagram.jpeg licensed with PD-USGov-NASA, PD-USGov-NASA/copyright
- 2006-09-12T15:16:24Z Giac83 540x417 (53453 Bytes) {{Information| |Description= This [[:en:carbon cycle]] diagram shows the storage and yearly changes of the carbon between the [[:en:Earth's atmosphere|atmosphere]], [[:en:hydrosphere]] and [[:en:geosphere]] in Gigatons - or b
Uploaded with derivativeFX
Captions
Add a one-line explanation of what this file represents
Items portrayed in this file
depicts
30 May 2008
image/svg+xml
ae5830808945c34e2c9739cbf7734f3cdac3f073
80,450 byte
460 pixel
600 pixel
File history
Click on a date/time to view the file as it appeared at that time.
| Date/Time | Thumbnail | Dimensions | User | Comment | |
|---|---|---|---|---|---|
| current | 20:26, 1 April 2024 | | 600 × 460 (65 KB) | Pko | Reverted to version as of 10:00, 8 September 2021 (UTC) |
| 13:26, 12 December 2021 |  | 600 × 460 (79 KB) | Pko | File uploaded using svgtranslate tool (https://svgtranslate.toolforge.org/). Added translation for pl. | |
| 10:00, 8 September 2021 |  | 600 × 460 (65 KB) | Pavouk | fix small error | |
| 09:53, 8 September 2021 |  | 600 × 460 (65 KB) | Pavouk | add Czech labels (correct numbers) | |
| 07:04, 28 August 2021 |  | 600 × 460 (65 KB) | Sarang | Version cleaned from toolforge-translator failures (222 W3C errors), structured: now easy to add more languages using a text editor | |
| 18:40, 19 August 2021 |  | 512 × 393 (88 KB) | Glrx | add systemLanguage="vi" in Dissolved Organic switch // Editing SVG source code using c:User:Rillke/SVGedit.js | |
| 01:52, 21 April 2021 |  | 512 × 393 (88 KB) | Tttrung | add Vietnamese translation | |
| 17:12, 19 February 2021 |  | 512 × 393 (85 KB) | YoaR | File uploaded using svgtranslate tool (https://svgtranslate.toolforge.org/). Added translation for ast. | |
| 11:40, 8 August 2020 |  | 512 × 393 (80 KB) | Persia | File uploaded using svgtranslate tool (https://svgtranslate.toolforge.org/). Added translation for fa. | |
| 09:05, 24 July 2020 |  | 512 × 393 (62 KB) | Sarang | The TOOLFORGE translations since 2020-07-08 generated 696 ID attributes, with 52 not-unique occurrencies = 52 W3C errors. The code is now cleaned from that garbage of ID and tspan. Please do not use buggy tools like Toolforge again! Insert new languages with a text editor. |
File usage
The following pages on the English Wikipedia use this file (pages on other projects are not listed):
- Aerobic methane production
- Arctic methane emissions
- Atmospheric carbon cycle
- Atmospheric methane
- Biogeochemical cycle
- Biological pump
- Black carbon
- C4 carbon fixation
- Carbon
- Carbon-based life
- Carbon-to-nitrogen ratio
- Carbon cycle
- Carbon dioxide in Earth's atmosphere
- Carbon dioxide removal
- Carbon respiration
- Carbon sequestration
- Carbonate compensation depth
- Carbonate–silicate cycle
- Climate change in Norway
- Continental shelf pump
- Deep carbon cycle
- Direct deep-sea carbon dioxide injection
- Dissolved inorganic carbon
- Dissolved organic carbon
- Ecological economics
- Ecosystem respiration
- Environmental economics
- Environmental engineering science
- Fire and carbon cycling in boreal forests
- Geochemistry of carbon
- Greenhouse gas emissions from wetlands
- Jelly-falls
- Kerogen
- Lipid pump
- Marine biogeochemical cycles
- Marine primary production
- Marine snow
- Martin curve
- Methane emissions
- Microbial loop
- Mycorrhizal fungi and soil carbon storage
- Natural capital
- Natural resource economics
- Net ecosystem production
- Nutrient cycle
- Oceanic carbon cycle
- Particulate inorganic carbon
- Particulate organic matter
- Permafrost carbon cycle
- Photorespiration
- Primary production
- Redfield ratio
- Reverse weathering
- Soil carbon
- Soil respiration
- Solubility pump
- Space-based measurements of carbon dioxide
- Terrestrial biological carbon cycle
- Total carbon
- Total inorganic carbon
- Total organic carbon
- Urban ecology
- Viral shunt
- Whale feces
- Talk:Carbon sequestration
- Talk:Environmental economics/Archive 1
- Talk:Sustainability/Archive 7
- Talk:Sustainability/Description
- Talk:Sustainability/Description/Archive 1
- User:Alan Liefting/Layout examples
- User:Clayoquot/CDR
- User:Cretog8/CyclesTemplate
- User:Daniel Mietchen/Talks/Biogeosciences and the Wikimedia ecosystem
- User:Daniel Mietchen/Talks/Ecological knowledge in the open knowledge ecosystem around Wikipedia
- User:Daniel Mietchen/Talks/Wetlands and the Wikimedia ecosystem
- User:Daniel Mietchen/gallery
- User:Delparastan/sandbox
- User:Epipelagic/sandbox/current1
- User:Frehman123/sandbox
- User:Jblockychop/Lipid pump
- User:Lonelychild1/Urban ecology
- User:Mirealauria/sandbox
- User:Shidali1/sandbox
- User talk:Alan Liefting/Archive 14
- Template:Carbon cycle
Global file usage
The following other wikis use this file:
- Usage on af.wikipedia.org
- Usage on ami.wikipedia.org
- Usage on ar.wikipedia.org
- Usage on ast.wikipedia.org
- Usage on as.wikipedia.org
- Usage on az.wikipedia.org
- Usage on beta.wikiversity.org
- Usage on bg.wikipedia.org
- Usage on bs.wikipedia.org
- Usage on cs.wikipedia.org
- Usage on da.wikipedia.org
- Usage on de.wikipedia.org
- Usage on de.wikibooks.org
- Usage on el.wikipedia.org
- Usage on en.wikibooks.org
- Usage on en.wikiversity.org
- Usage on eo.wikipedia.org
- Usage on es.wikipedia.org
- Usage on et.wikipedia.org
- Usage on eu.wikipedia.org
View more global usage of this file.
Metadata
This file contains additional information, probably added from the digital camera or scanner used to create or digitize it.
If the file has been modified from its original state, some details may not fully reflect the modified file.
| Width | 600 |
|---|---|
| Height | 460 |
Retrieved from "https://en.wikipedia.org/wiki/File:Carbon_cycle-cute_diagram.svg"