Top Qs
Timeline
Chat
Perspective
Gantt chart
Type of chart to show a project schedule From Wikipedia, the free encyclopedia
Remove ads
A Gantt chart is a bar chart that illustrates a project schedule.[1] It was designed and popularized by Henry Gantt around the years 1910–1915.[2][3] Modern Gantt charts also show the dependency relationships between activities and the current schedule status.


Remove ads
Definition
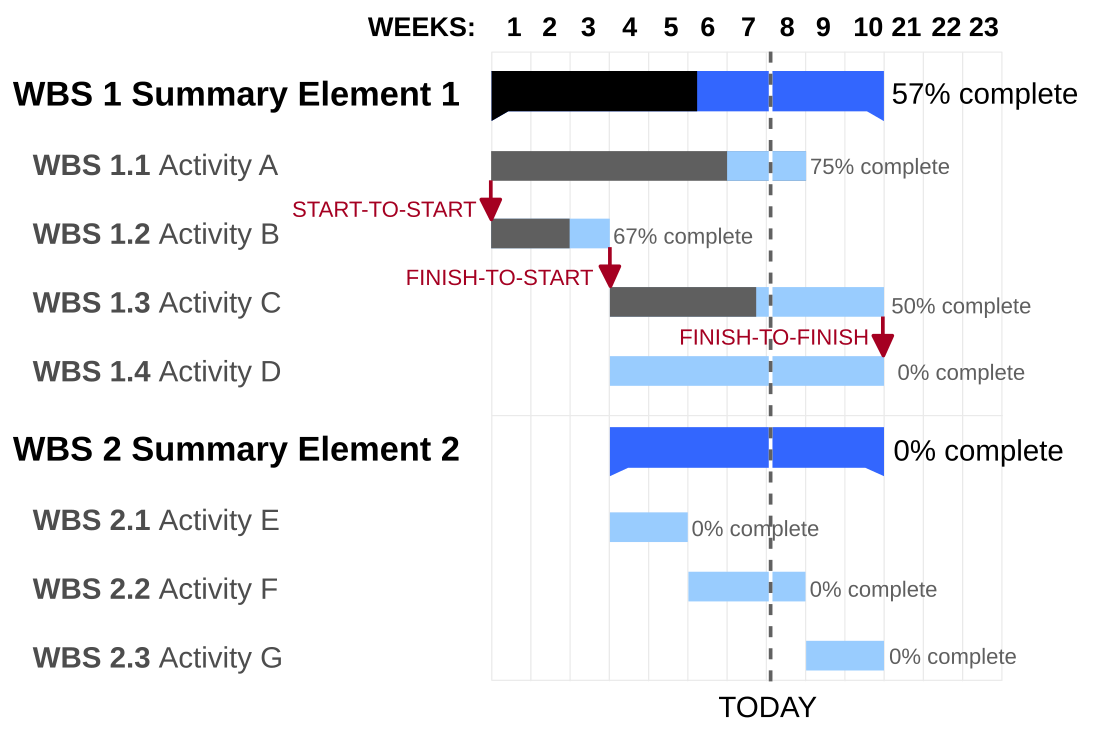
A Gantt chart is a type of bar chart[4][5] that illustrates a project schedule.[6] This chart lists the tasks to be performed on the vertical axis, and time intervals on the horizontal axis.[4][7] The width of the horizontal bars in the graph shows the duration of each activity.[7][8] Gantt charts illustrate the start and finish dates of the terminal elements and summary elements of a project.[1] Terminal elements and summary elements constitute the work breakdown structure of the project. Modern Gantt charts also show the dependency (i.e., precedence network) relationships between activities. Gantt charts can be used to show current schedule status using percent-complete shadings and a vertical "TODAY" line.
Gantt charts are sometimes equated with bar charts.[8][9]
Gantt charts are usually created initially using an early start time approach, where each task is scheduled to start immediately when its prerequisites are complete. This method maximizes the float time available for all tasks.[4]
Remove ads
History
Summarize
Perspective
Widely used in project planning in the present day, Gantt charts were considered revolutionary when introduced.[10] The first known tool of this type was developed in 1896 by Karol Adamiecki, who called it a harmonogram.[11] Adamiecki, however, published his chart only in Russian and Polish which limited both its adoption and recognition of his authorship.
In 1912, Hermann Schürch published what could be considered Gantt charts while discussing a construction project. Charts of the type published by Schürch appear to have been in common use in Germany at the time;[12][13][14] however, the prior development leading to Schürch's work is unclear.[15] Unlike later Gantt charts, Schürch's charts did not display interdependencies, leaving them to be inferred by the reader. These were also static representations of a planned schedule.[16]
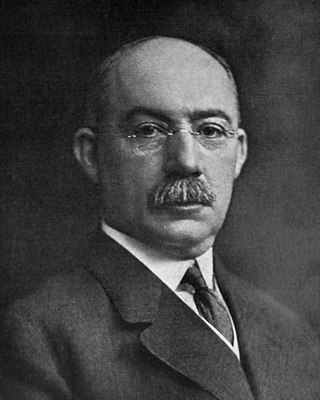
The chart is named after Henry Gantt (1861–1919), who designed his chart around the years 1910–1915.[2][3] Gantt originally created his tool for systematic, routine operations. He designed this visualization tool to more easily measure productivity levels of employees and gauge which employees were under- or over-performing. Gantt also frequently included graphics and other visual indicators in his charts to track performance.[17]
One of the first major applications of Gantt charts was by the United States during World War I, at the instigation of General William Crozier.[18]
The earliest Gantt charts were drawn on paper and therefore had to be redrawn entirely in order to adjust to schedule changes. For many years, project managers used pieces of paper or blocks for Gantt chart bars so they could be adjusted as needed.[19] Gantt's collaborator Walter Polakov introduced Gantt charts to the Soviet Union in 1929 when he was working for the Supreme Soviet of the National Economy. They were used in developing the First Five Year Plan, supplying Russian translations to explain their use.[20][21]
In the 1980s, personal computers allowed widespread creation of complex and elaborate Gantt charts. The first desktop applications were intended mainly for project managers and project schedulers. With the advent of the Internet and increased collaboration over networks at the end of the 1990s, Gantt charts became a common feature of web-based applications, including collaborative groupware.[citation needed] By 2012, almost all Gantt charts were made by software which can easily adjust to schedule changes.[19]
In 1999, Gantt charts were identified as "one of the most widely used management tools for project scheduling and control".[4]
Remove ads
Example
Summarize
Perspective
In the following tables there are seven tasks, labeled a through g. Some tasks can be done concurrently (a and b) while others cannot be done until their predecessor task is complete (c and d cannot begin until a is complete). Additionally, each task has three time estimates: the optimistic time estimate (O), the most likely or normal time estimate (M), and the pessimistic time estimate (P). The expected time (TE) is estimated using the beta probability distribution for the time estimates, using the formula (O + 4M + P) ÷ 6.
Once this step is complete, one can draw a Gantt chart or a network diagram.

Progress Gantt charts
In a progress Gantt chart, tasks are shaded in proportion to the degree of their completion: a task that is 60% complete would be 60% shaded, starting from the left. A vertical line is drawn at the time index when the progress Gantt chart is created, and this line can then be compared with shaded tasks. If everything is on schedule, all task portions left of the line will be shaded, and all task portions right of the line will not be shaded. This provides a visual representation of how the project and its tasks are ahead or behind schedule.[22]
Remove ads
Linked Gantt charts
Linked Gantt charts contain lines indicating the dependencies between tasks. However, linked Gantt charts quickly become cluttered in all but the simplest cases. Critical path network diagrams are superior to visually communicate the relationships between tasks.[23] Nevertheless, Gantt charts are often preferred over network diagrams because Gantt charts are easily interpreted without training, whereas critical path diagrams require training to interpret.[9] Gantt chart software typically provides mechanisms to link task dependencies, although this data may or may not be visually represented.[4] Gantt charts and network diagrams are often used for the same project, both being generated from the same data by a software application.[4]
Remove ads
Criticism
The Gantt chart's widespread adoption is perhaps less based on its universal application and suitability as perhaps the absence of any alternative. It flattens assumptions, which in turn can constrain the ability to respond to uncertainty and change.[24]
See also
- Critical path method
- Data and information visualization
- Event chain methodology
- Float (project management)
- List of project management software, which includes specific Gantt chart software.
- Program evaluation and review technique (PERT)
- Progress bar
- Event chain diagram
Citations
References
Further reading
External links
Wikiwand - on
Seamless Wikipedia browsing. On steroids.
Remove ads
