The ceremonial county of Devon, which includes the unitary authorities of Torbay and Plymouth, is divided into 12 Parliamentary constituencies: 4 Borough constituencies and 8 County constituencies.
Constituencies
In the 2024 United Kingdom general election, Devon elected the following MPs:
† Conservative ‡ Labour ¤ Liberal Democrat
| Constituency[nb 1] | Electorate | Majority | Member of Parliament | Nearest opposition | Map | ||
|---|---|---|---|---|---|---|---|
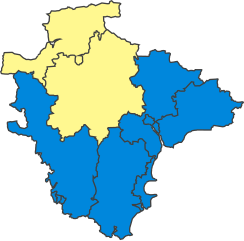
| Central Devon | 75,385 | 61 | Mel Stride† | Ollie Pearson‡ |  | ||
| Exeter | 67,840 | 11,937 | Steve Race‡ | Tessa Tucker† |  | ||
| Exmouth and Exeter East | 79,983 | 121 | David Reed† | Helen Dallimore‡ |  | ||
| Honiton and Sidmouth | 75,537 | 6,700 | Richard Foord¤ | Simon Jupp† |  | ||
| Newton Abbot | 73,885 | 2,246 | Martin Wrigley¤ | Anne-Marie Morris† |  | ||
| North Devon | 79,068 | 6,744 | Ian Roome¤ | Selaine Saxby† |  | ||
| Plymouth Moor View | 74,724 | 5,604 | Fred Thomas‡ | Johnny Mercer† |  | ||
| Plymouth Sutton and Devonport | 75,313 | 13,328 | Luke Pollard‡ | Peter Gold (Reform UK) |
 | ||
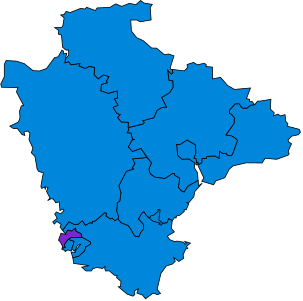
| South Devon | 70,755 | 7,127 | Caroline Voaden¤ | Anthony Mangnall† |  | ||
| South West Devon | 77,600 | 2,112 | Rebecca Smith† | Sarah Allen‡ |  | ||
| Torbay | 76,179 | 5,349 | Steve Darling¤ | Kevin Foster† |  | ||
| Torridge and Tavistock | 74,727 | 3,950 | Geoffrey Cox† | Phil Hutty¤ |  | ||
| Tiverton and Minehead | 71,843 | 3,507 | Rachel Gilmour¤ | Ian Liddell-Grainger† |  | ||
2024 boundary changes
See 2023 Periodic Review of Westminster constituencies for further details.
| Former name | Boundaries 2010–2024 | Current name | Boundaries 2024–present |
|---|---|---|---|
 |
 | ||
For the 2023 Periodic Review of Westminster constituencies, which redrew the constituency map ahead of the 2024 United Kingdom general election, the Boundary Commission for England opted to combine Devon with Avon and Somerset as a sub-region of the South West Region, resulting in significant change to the existing pattern of constituencies. In Devon, East Devon, and Tiverton & Honiton were abolished, being replaced by Exmouth & Exeter East, Honiton & Sidmouth, and the cross-county boundary constituency of Tiverton & Minehead. Torridge & West Devon and Totnes were renamed Torridge & Tavistock, and South Devon respectively, despite only minor boundary changes to each.[1][2]
The following seats resulted from the boundary review:
Containing electoral wards from East Devon
- Exmouth and Exeter East (part)
- Honiton and Sidmouth (part)
Containing electoral wards from Exeter
- Exeter
- Exmouth and Exeter East (part)
Containing electoral wards from Mid Devon
- Central Devon (part)
- Honiton and Sidmouth (part)
- Tiverton and Minehead (part in the Somerset District of Somerset West and Taunton)
Containing electoral wards from North Devon
Containing electoral wards from Plymouth
Containing electoral wards from South Hams
- South West Devon (part)
- South Devon (part)
Containing electoral wards from Teignbridge
- Central Devon (part)
- Newton Abbot
Containing electoral wards from Torbay
- Torbay
- South Devon (part)
Containing electoral wards from Torridge
- Torridge and Tavistock (part)
Containing electoral wards from West Devon
- Central Devon (part)
- South West Devon (part)
- Torridge and Tavistock (part)
Results history
Primary data source: House of Commons research briefing - General election results from 1918 to 2019[3]
2024
| Party | Votes | % | Change from 2019 | Seats | Change from 2019 |
|---|---|---|---|---|---|
| Conservative | 165,316 | 28.7% | 4 | ||
| Labour | 135,300 | 23.5% | 3 | ||
| Liberal Democrats | 143,624 | 24.9% | 5 | ||
| Greens | 41,036 | 7.1% | 0 | 0 | |
| reform | 85,711 | 14.9% | 0 | 0 | |
| Others | 4,690 | 0.8% | 0 | 0 | |
| Total | 575,677 | 100.0 | 12 |
2019
The number of votes cast for each political party who fielded candidates in constituencies comprising Devon in the 2019 general election were as follows:
| Party | Votes | % | Change from 2017 | Seats | Change from 2017 |
|---|---|---|---|---|---|
| Conservative | 355,052 | 53.9% | 10 | 0 | |
| Labour | 150,169 | 22.8% | 2 | 0 | |
| Liberal Democrats | 96,809 | 14.7% | 0 | 0 | |
| Greens | 22,004 | 3.3% | 0 | 0 | |
| Brexit | 4,337 | 0.7% | new | 0 | 0 |
| Others | 30,836 | 4.6% | 0 | 0 | |
| Total | 659,207 | 100.0 | 12 |
Percentage votes
| Election year | 1924 | 1929 | 1945 | 1950 | 1951 | 1955 | 1959 | 1964 | 1966 | 1970 | 1974
(Feb) |
1974
(Oct) |
1979 | 1983 | 1987 | 1992 | 1997 | 2001 | 2005 | 2010 | 2015 | 2017 | 2019 |
|---|---|---|---|---|---|---|---|---|---|---|---|---|---|---|---|---|---|---|---|---|---|---|---|
| Conservative1 | 52.3 | 43.0 | 49.3 | 50.3 | 55.8 | 55.3 | 52.9 | 47.6 | 47.5 | 52.8 | 45.5 | 45.0 | 43.9 | 52.8 | 49.5 | 47.6 | 36.8 | 39.0 | 38.1 | 43.3 | 46.2 | 51.1 | 53.9 |
| Labour | 13.7 | 16.3 | 34.1 | 34.1 | 36.5 | 33.3 | 27.6 | 26.9 | 32.8 | 29.4 | 21.8 | 24.9 | 22.1 | 11.1 | 13.1 | 19.2 | 25.9 | 23.6 | 20.4 | 14.2 | 18.0 | 29.0 | 22.8 |
| Liberal Democrat2 | 34.0 | 36.4 | 16.2 | 15.6 | 7.7 | 11.3 | 19.5 | 25.5 | 19.6 | 17.8 | 32.6 | 29.9 | 22.8 | 35.4 | 36.6 | 30.3 | 31.3 | 31.9 | 32.7 | 33.4 | 13.2 | 12.5 | 14.7 |
| Green Party | - | - | - | - | - | - | - | - | - | - | - | - | - | - | * | * | * | * | * | 1.6 | 5.6 | 2.0 | 3.3 |
| UKIP | - | - | - | - | - | - | - | - | - | - | - | - | - | - | - | - | * | * | * | 6.1 | 14.6 | 1.7 | * |
| Brexit Party | - | - | - | - | - | - | - | - | - | - | - | - | - | - | - | - | - | - | - | - | - | - | 0.7 |
| Other | - | 4.2 | 0.4 | 0.1 | - | - | - | - | - | - | 0.1 | 0.2 | 1.2 | 0.7 | 0.9 | 2.9 | 6.1 | 5.5 | 8.8 | 1.3 | 2.3 | 3.7 | 4.6 |
1Includes National Liberal Party up to 1966 and one National candidate in 1945
2pre-1979 - Liberal; 1983 & 1987 - SDP-Liberal Alliance
* Included in Other
Meaningful vote percentages are not available for the elections of 1918, 1922, 1923, 1931 and 1935 since at least one seat was gained unopposed.
Seats
| Election year | 1950 | 1951 | 1955 | 1959 | 1964 | 1966 | 1970 | 1974
(Feb) |
1974
(Oct) |
1979 | 1983 | 1987 | 1992 | 1997 | 2001 | 2005 | 2010 | 2015 | 2017 | 2019 |
|---|---|---|---|---|---|---|---|---|---|---|---|---|---|---|---|---|---|---|---|---|
| Conservative1 | 8 | 9 | 10 | 9 | 9 | 7 | 8 | 8 | 8 | 9 | 10 | 10 | 9 | 5 | 4 | 5 | 8 | 11 | 10 | 10 |
| Labour | 2 | 1 | 0 | 0 | 0 | 2 | 1 | 1 | 1 | 1 | 0 | 0 | 1 | 3 | 3 | 3 | 2 | 1 | 2 | 2 |
| Liberal Democrat2 | 0 | 0 | 0 | 1 | 1 | 1 | 1 | 1 | 1 | 0 | 1 | 1 | 1 | 3 | 4 | 3 | 2 | 0 | 0 | 0 |
| Total | 10 | 10 | 10 | 10 | 10 | 10 | 10 | 10 | 10 | 10 | 11 | 11 | 11 | 11 | 11 | 11 | 12 | 12 | 12 | 12 |
1Includes National Liberal Party up to 1966
21950-1979 - Liberal; 1983 & 1987 - SDP-Liberal Alliance
Maps
1885-1910
 1885
1885 1886
1886 1892
1892 1895
1895 1900
1900 1906
1906 Jan 1910
 Dec 1910


1918-1945
 1918
1918 1922
1922 1923
1923 1924
1924 1929
1929 1931
1931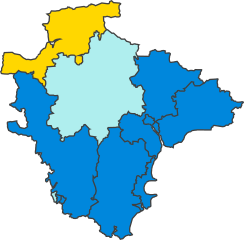 1935
1935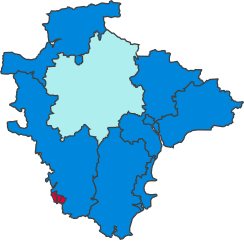 1945
1945


1950-1979
 1950
1950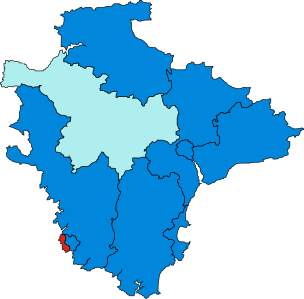 1951
1951 1955
1955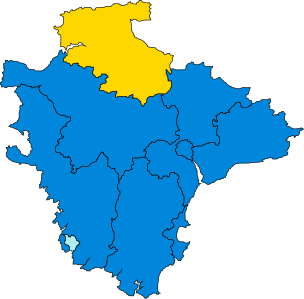 1959
1959 1964
1964 1966
1966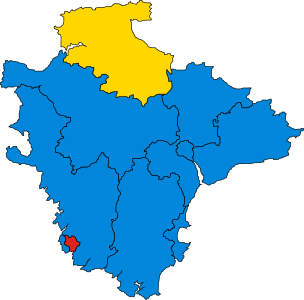 1970
1970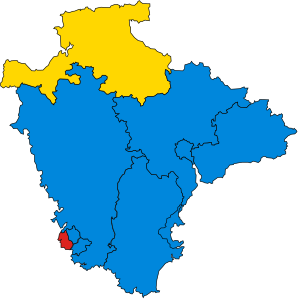 1974 Feb
- 1974 Oct
 1979
1979


1983-present
 1983
1983- 1987
 1992
1992 1997
1997 2001
2001 2005
2005 2010
2010 2015
2015 2017
2017- 2019
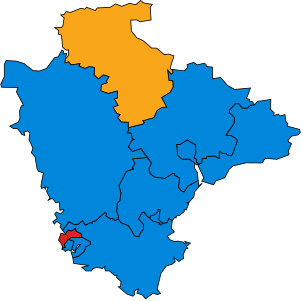
 2024
2024


Historical results by party
A cell marked → (with a different colour background to the preceding cell) indicates that the previous MP continued to sit under a new party name.
1885 to 1906 (13 MPs)
Conservative Liberal Liberal Unionist
| Constituency | 1885 | 1886 | 91 | 1892 | 1895 | 98 | 99 | 00 | 1900 | 02 | 04 |
|---|---|---|---|---|---|---|---|---|---|---|---|
| Ashburton | Seale-Hayne | Eve | |||||||||
| Barnstaple | Pitt-Lewis | → | Billson | Gull | Soares | ||||||
| Devonport (two MPs) | Puleston | Morton | Lockie | J. Benn | |||||||
| Price | Kearley | ||||||||||
| Exeter | Northcote | Vincent | |||||||||
| Honiton | Kennaway | ||||||||||
| Plymouth (two MPs) | Clarke | Guest | → | ||||||||
| Bates | Pearce | Harrison | Mendl | Duke | |||||||
| South Molton | Wallop | → | Lambert | ||||||||
| Tavistock | Fortescue | → | Luttrell | Spear | |||||||
| Tiverton | Walrond | ||||||||||
| Torquay | McIver | Mallock | Philpotts | Layland-Barratt | |||||||
| Totnes | Mildmay | → | |||||||||
1906 to 1918 (13 MPs)
Conservative Liberal Liberal Unionist
| Constituency | 1906 | 08 | Jan 1910 | Dec 1910 | 11 | 12 | 15 | 18 |
|---|---|---|---|---|---|---|---|---|
| Ashburton | Eve | Morrison-Bell | Buxton | Morrison-Bell | → | |||
| Barnstaple | Soares | Baring | ||||||
| Devonport (two MPs) | J. Benn | Jackson | ||||||
| Kearley | Kinloch-Cooke | |||||||
| Exeter | Kekewich | Duke | St Maur | Duke | Newman | |||
| Honiton | Kennaway | Morrison-Bell | ||||||
| Plymouth (two MPs) | Dobson | Williams | W. Astor | |||||
| Mallet | A. Benn | |||||||
| South Molton | Lambert | |||||||
| Tavistock | Luttrell | Spear | ||||||
| Tiverton | Walrond jnr | Carew | ||||||
| Torquay | Layland-Barratt | Burn | → | |||||
| Totnes | → | → | ||||||
1918 to 1950 (11 MPs)
Coalition Liberal (1918-22) / National Liberal (1922-23) Common Wealth Conservative Independent Conservative Independent National Labour Liberal National Liberal (1931-68)
| Constituency | 1918 | 19 | 1922 | 23 | 1923 | 1924 | 28 | 1929 | 31 | 1931 | 1935 | 37 | 42 | 1945 |
|---|---|---|---|---|---|---|---|---|---|---|---|---|---|---|
| Barnstaple | Rees | B. Peto | Rees | B. Peto | R. Dyke Acland | → | C. Peto | |||||||
| Exeter | Newman | → | Reed | Maude | ||||||||||
| Honiton | Morrison-Bell | Drewe | ||||||||||||
| Plymouth Devonport | Kinloch-Cooke | Hore-Belisha | → | → | Foot | |||||||||
| Plymouth Drake | A. Benn | Moses | F. Guest | C. Guest | Medland | |||||||||
| Plymouth Sutton | W. Astor | N. Astor | Middleton | |||||||||||
| South Molton | Lambert | → | Drewe | Lambert | → | Lambert jnr | ||||||||
| Tavistock | Williams | Thornton | Kenyon-Slaney | Wright | Patrick | Studholme | ||||||||
| Tiverton | Carew | Sparkes | F. Dyke Acland | Acland-Troyte | Heathcoat-Amory | |||||||||
| Torquay | Burn | Thompson | Williams | |||||||||||
| Totnes | Mildmay | Harvey | Vivian | Harvey | Rayner | |||||||||
1950 to 1983 (10 MPs)
Conservative Labour Liberal National Liberal (1931-68) Social Democratic
| Constituency | 1950 | 1951 | 1955 | 55 | 58 | 1959 | 60 | 1964 | 1966 | 67 | 1970 | Feb 74 | Oct 74 | 1979 | 81 |
|---|---|---|---|---|---|---|---|---|---|---|---|---|---|---|---|
| Tavistock | Studholme | Heseltine | |||||||||||||
| Devon North | C. Peto | Lindsay | Thorpe | Speller | |||||||||||
| Exeter | Maude | Dudley-Williams | Dunwoody | Hannam | |||||||||||
| Honiton | Drewe | Mathew | Emery | ||||||||||||
| Plymouth Devonport | Foot | Vickers | → | Owen | → | ||||||||||
| Plymouth Sutton | Middleton | J. Astor | Fraser | Owen | Clark | ||||||||||
| Tiverton | Heathcoat-Amory | Maxwell-Hyslop | |||||||||||||
| Torquay / Torbay (1974) | Williams | Bennett | |||||||||||||
| Torrington / Devon West (1974) | Lambert jnr | Bonham-Carter | Browne | Mills | |||||||||||
| Totnes | Rayner | Mawby | |||||||||||||
| Plymouth Drake | Fookes | ||||||||||||||
1983 to 2010 (11 MPs)
Conservative Independent Labour Liberal Democrats Social Democratic (1983-88) / Social Democratic Party (1988-90)
| Constituency | 1983 | 1987 | 90 | 1992 | 95 | 1997 | 2001 | 2005 |
|---|---|---|---|---|---|---|---|---|
| Plymouth Drake | Fookes | |||||||
| Devon North | Speller | Harvey | ||||||
| Devon West and Torridge | Mills | Nicholson | → | Burnett | Cox | |||
| Exeter | Hannam | Bradshaw | ||||||
| Honiton (1983–97) / East Devon (1997) | Emery | Swire | ||||||
| Plymouth Devonport | Owen | → | Jamieson | Seabeck | ||||
| Plymouth Sutton | Clark | Streeter | Gilroy | |||||
| South Hams (1983–97) / Totnes (1997) | Steen | |||||||
| Teignbridge | Nicholls | Younger-Ross | ||||||
| Tiverton (1983–97) / Tiverton & Honiton (1997) | Maxwell-Hyslop | Browning | ||||||
| Torbay | Bennett | Allason | Sanders | |||||
| South West Devon | Streeter | |||||||
2010 to present (12 MPs)
Change UK Conservative Independent Labour Liberal Democrats
| Constituency | 2010 | 2015 | 2017 | 17 | 17 | 19 | 2019 | 22 | 2024 | ||
|---|---|---|---|---|---|---|---|---|---|---|---|
| Central Devon | Stride | ||||||||||
| Devon North | Harvey | Heaton-Jones | Saxby | Roome | |||||||
| Devon W & Torridge (2010–24) / Torridge & Tavistock (2024) | Cox | ||||||||||
| East Devon (2010–24) / Exmouth & Exeter East (2024) | Swire | Jupp | Reed | ||||||||
| Exeter | Bradshaw | Race | |||||||||
| Newton Abbot | Morris | → | → | → | → | Wrigley | |||||
| Plymouth Moor View | Seabeck | Mercer | Thomas | ||||||||
| Plymouth Sutton & Devonport | Colvile | Pollard | |||||||||
| South West Devon | Streeter | Smith | |||||||||
| Tiverton & Honiton1 / Honiton & Sidmouth (2024) | Parish | → | Foord | ||||||||
| Torbay | Sanders | Foster | Darling | ||||||||
| Totnes (2010–24) / South Devon (2024) | Wollaston | → | → | Mangnall | Voaden | ||||||
1parts transferred in 2024 to Tiverton and Minehead which is mostly in Somerset
See also
Notes
- BC denotes borough constituency, CC denotes county constituency.
References
Wikiwand in your browser!
Seamless Wikipedia browsing. On steroids.
Every time you click a link to Wikipedia, Wiktionary or Wikiquote in your browser's search results, it will show the modern Wikiwand interface.
Wikiwand extension is a five stars, simple, with minimum permission required to keep your browsing private, safe and transparent.