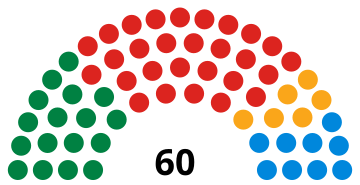
The 1999 National Assembly for Wales election was held on Thursday 6 May 1999 to elect 60 members to the Senedd, at the time called the National Assembly for Wales (Welsh Parliament; Welsh: Cynulliad Cenedlaethol Cymru). It was the first devolved general election held in Wales after the successful 1997 Welsh devolution referendum. The election was held alongside the Scottish Parliament election (also the first of its kind) and English local elections.
| |||||||||||||||||||||||||||||||||||||||||||||||||||||||||||||||||
All 60 seats to the National Assembly for Wales 31 seats needed for a majority | |||||||||||||||||||||||||||||||||||||||||||||||||||||||||||||||||
|---|---|---|---|---|---|---|---|---|---|---|---|---|---|---|---|---|---|---|---|---|---|---|---|---|---|---|---|---|---|---|---|---|---|---|---|---|---|---|---|---|---|---|---|---|---|---|---|---|---|---|---|---|---|---|---|---|---|---|---|---|---|---|---|---|---|
| Turnout | 46.3% | ||||||||||||||||||||||||||||||||||||||||||||||||||||||||||||||||
| |||||||||||||||||||||||||||||||||||||||||||||||||||||||||||||||||
 | |||||||||||||||||||||||||||||||||||||||||||||||||||||||||||||||||
Although Welsh Labour were the biggest party, they did not gain enough seats to form a majority government and instead entered into coalition with the Liberal Democrats. The election was marked by the historically high level of support for Plaid Cymru, who won their highest share of the vote in any Wales-wide election and remains their highest number of seats in a Senedd election to date. The party won considerable support in traditionally safe Labour areas such as the South Wales Valleys, winning Rhondda and Islwyn and narrowly failing to win a number of other seats.
The overall turnout of voters was 46.3%.[1] This would remain the highest ever turnout for a devolved election in Wales until the 2021 Senedd election, which saw 46.6 of voters cast their ballot.[2]

Election results
- Overall turnout: 46.3%
 | ||||||||||||||||
| Parties | Additional member system | Total seats | ||||||||||||||
|---|---|---|---|---|---|---|---|---|---|---|---|---|---|---|---|---|
| Constituency | Region | |||||||||||||||
| Votes | % | +/− | Seats | +/− | Votes | % | +/− | Seats | +/− | Total | +/− | % | ||||
| Labour | 384,671 | 37.6 | N/A | 27 | N/A | 361,657 | 35.4 | N/A | 1 | N/A | 28 | N/A | 46.7 | |||
| Plaid Cymru | 290,572 | 28.4 | N/A | 9 | N/A | 312,048 | 30.5 | N/A | 8 | N/A | 17 | N/A | 28.3 | |||
| Conservative | 162,133 | 15.8 | N/A | 1 | N/A | 168,206 | 16.5 | N/A | 8 | N/A | 9 | N/A | 15.0 | |||
| Liberal Democrats | 137,857 | 13.5 | N/A | 3 | N/A | 128,008 | 12.5 | N/A | 3 | N/A | 6 | N/A | 10.0 | |||
| Green | 1,002 | 0.1 | N/A | 0 | N/A | 25,858 | 2.5 | N/A | 0 | N/A | 0 | N/A | 0 | |||
| Socialist Labour | - | - | - | - | - | 10,720 | 1.0 | N/A | 0 | N/A | 0 | N/A | 0 | |||
| Natural Law | - | - | - | - | - | 3,861 | 0.4 | N/A | 0 | N/A | 0 | N/A | 0 | |||
| United Socialist | 3,967 | 0.4 | N/A | 0 | N/A | 3,590 | 0.4 | N/A | 0 | N/A | 0 | N/A | 0 | |||
| Communist | 609 | 0.1 | N/A | 0 | N/A | 1,366 | 0.1 | N/A | 0 | N/A | 0 | N/A | 0 | |||
| Independent | 30,554 | 3.0 | N/A | 0 | N/A | - | - | - | - | - | 0 | N/A | 0 | |||
| Independent Labour | 4,134 | 0.4 | N/A | 0 | N/A | - | - | - | - | - | 0 | N/A | 0 | |||
| Others | 7,736 | 0.8 | N/A | 0 | N/A | 4,673 | 0.5 | N/A | 0 | N/A | 0 | N/A | 0 | |||
| Total | 1,023,225 | 40 | 1,019,987 | 20 | 60 | |||||||||||
Votes summary
Constituency and regional summary
Mid and West Wales
| Constituency | Elected member | Result | |
|---|---|---|---|
| Carmarthen East and Dinefwr | Rhodri Glyn Thomas | Plaid Cymru win | |
| Carmarthen West and South Pembrokeshire | Christine Gwyther | Labour win | |
| Ceredigion | Elin Jones | Plaid Cymru win | |
| Llanelli | Helen Mary Jones | Plaid Cymru win | |
| Meirionnydd Nant Conwy | Dafydd Elis-Thomas | Plaid Cymru win | |
| Montgomeryshire | Mick Bates | Liberal Democrats win | |
| Preseli Pembrokeshire | Richard Edwards | Labour win | |
| Brecon and Radnorshire | Kirsty Williams | Liberal Democrats win | |
| Party | Elected candidates | Seats | +/− | Votes | % | +/−% | |
|---|---|---|---|---|---|---|---|
| Plaid Cymru | Cynog Dafis | 1 | N/A | 84,554 | 38.55% | N/A | |
| Labour | Alun Michael | 1 | N/A | 53,842 | 24.55% | N/A | |
| Conservative | Nick Bourne Edward Glyn Davies |
2 | N/A | 36,622 | 16.70% | N/A | |
| Liberal Democrats | 0 | N/A | 31,683 | 14.44% | N/A | ||
| Green | 0 | N/A | 7,718 | 3.52% | N/A | ||
| Socialist Labour | 0 | N/A | 3,019 | 1.38% | N/A | ||
| Independent | 0 | N/A | 1,214 | 0.55% | N/A | ||
| Natural Law | 0 | N/A | 705 | 0.32% | N/A | ||
North Wales
| Constituency | Elected member | Result | |
|---|---|---|---|
| Alyn and Deeside | Tom Middlehurst | Labour win | |
| Caernarfon | Dafydd Wigley | Plaid Cymru win | |
| Clwyd South | Karen Sinclair | Labour win | |
| Clwyd West | Alun Pugh | Labour win | |
| Conwy | Gareth Jones | Plaid Cymru win | |
| Delyn | Alison Halford | Labour win | |
| Vale of Clwyd | Margaret Ann Jones | Labour win | |
| Wrexham | John Marek | Labour win | |
| Ynys Môn | Ieuan Wyn Jones | Plaid Cymru win | |
| Party | Elected candidates | Seats | +/− | Votes | % | +/−% | |
|---|---|---|---|---|---|---|---|
| Labour | 0 | N/A | 73,673 | 34.19% | N/A | ||
| Plaid Cymru | Janet Ryder | 1 | N/A | 69,518 | 32.26% | N/A | |
| Conservative | Rod Richards Peter Rogers |
2 | N/A | 41,700 | 19.35% | N/A | |
| Liberal Democrats | Christine Humphreys | 1 | N/A | 22,130 | 10.27% | N/A | |
| Green | 0 | N/A | 4,667 | 2.17% | N/A | ||
| Rhuddlan Debt Protest Campaign | 0 | N/A | 1,353 | 0.63% | N/A | ||
| Natural Law | 0 | N/A | 917 | 0.43% | N/A | ||
| Socialist Alliance | 0 | N/A | 828 | 0.38% | N/A | ||
| Communist | 0 | N/A | 714 | 0.33% | N/A | ||
South Wales Central
| Constituency | Elected member | Result | |
|---|---|---|---|
| Cardiff South and Penarth | Lorraine Barrett | Labour win | |
| Cardiff West | Rhodri Morgan | Labour win | |
| Cynon Valley | Christine Chapman | Labour win | |
| Pontypridd | Jane Davidson | Labour win | |
| Rhondda | Geraint Rhys Davies | Plaid Cymru win | |
| Vale of Glamorgan | Jane Hutt | Labour win | |
| Cardiff Central | Jennifer Elizabeth Randerson | Liberal Democrats win | |
| Cardiff North | Sue Essex | Labour win | |
| Party | Elected candidates | Seats | +/− | Votes | % | +/−% | |
|---|---|---|---|---|---|---|---|
| Labour | 0 | N/A | 79,564 | 36.92% | N/A | ||
| Plaid Cymru | Pauline Jarman Owen John Thomas |
2 | N/A | 58,080 | 26.95% | N/A | |
| Conservative | Jonathan Morgan David Melding |
2 | N/A | 34,944 | 16.22% | N/A | |
| Liberal Democrats | 0 | N/A | 30,911 | 14.35% | N/A | ||
| Green | 0 | N/A | 5,336 | 2.48% | N/A | ||
| Socialist Labour | 0 | N/A | 2,822 | 1.31% | N/A | ||
| Independent | 0 | N/A | 1,524 | 0.71% | N/A | ||
| Natural Law | 0 | N/A | 665 | 0.31% | N/A | ||
| Communist | 0 | N/A | 652 | 0.30% | N/A | ||
| Socialist Alliance | 0 | N/A | 602 | 0.28% | N/A | ||
| Independent | 0 | N/A | 378 | 0.18% | N/A | ||
South Wales East
| Constituency | Elected member | Result | |
|---|---|---|---|
| Islwyn | Brian Hancock | Plaid Cymru win | |
| Merthyr Tydfil and Rhymney | Huw Lewis | Labour win | |
| Monmouth | David Davies | Conservative win | |
| Blaenau Gwent | Peter Law | Labour win | |
| Newport East | John Griffiths | Labour win | |
| Newport West | Rosemary Butler | Labour win | |
| Torfaen | Lynne Neagle | Labour win | |
| Caerphilly | Ron Davies | Labour win | |
| Party | Elected candidates | Seats | +/− | Votes | % | +/−% | |
|---|---|---|---|---|---|---|---|
| Labour | 0 | N/A | 83,953 | 41.82% | N/A | ||
| Plaid Cymru | Jocelyn Davies Professor Philip James Stradling Williams |
2 | N/A | 49,139 | 24.48% | N/A | |
| Conservative | William Graham | 1 | N/A | 33,947 | 16.91% | N/A | |
| Liberal Democrats | Michael James German | 1 | N/A | 24,757 | 12.33% | N/A | |
| Socialist Labour | 0 | N/A | 4,879 | 2.43% | N/A | ||
| Green | 0 | N/A | 4,055 | 2.02% | N/A | ||
South Wales West
| Constituency | Elected member | Result | |
|---|---|---|---|
| Aberavon | Brian Gibbons | Labour win | |
| Gower | Edwina Hart | Labour win | |
| Neath | Gwenda Thomas | Labour win | |
| Ogmore | Janice Gregory | Labour win | |
| Swansea East | Val Feld | Labour win | |
| Swansea West | Andrew Davies | Labour win | |
| Bridgend | Carwyn Jones | Labour win | |
| Party | Elected candidates | Seats | +/− | Votes | % | +/−% | |
|---|---|---|---|---|---|---|---|
| Labour | 0 | N/A | 70,625 | 42.25% | N/A | ||
| Plaid Cymru | Janet Marion Davies Dr David Rees Lloyd |
2 | N/A | 50,757 | 30.37% | N/A | |
| Conservative | Alun Cairns | 1 | N/A | 20,993 | 12.56% | N/A | |
| Liberal Democrats | Peter Black | 1 | N/A | 18.527 | 11.09% | N/A | |
| Green | 0 | N/A | 4,082 | 2.44% | N/A | ||
| Socialist Alliance | 0 | N/A | 1,257 | 0.75% | N/A | ||
| Natural Law | 0 | N/A | 676 | 0.40% | N/A | ||
| People's Representative Party | 0 | N/A | 204 | 0.12% | N/A | ||
Opinion polls
See also
- Senedd (formerly National Assembly for Wales)
- Senedd constituencies and electoral regions
References
External links
Wikiwand in your browser!
Seamless Wikipedia browsing. On steroids.
Every time you click a link to Wikipedia, Wiktionary or Wikiquote in your browser's search results, it will show the modern Wikiwand interface.
Wikiwand extension is a five stars, simple, with minimum permission required to keep your browsing private, safe and transparent.


