Top Qs
Timeline
Chat
Perspective
Venn diagram
Diagram that shows all possible logical relations between a collection of sets From Wikipedia, the free encyclopedia

Remove ads
A Venn diagram is a widely used diagram style that shows the logical relation between sets, popularized by John Venn (1834–1923) in the 1880s. The diagrams are used to teach elementary set theory, and to illustrate simple set relationships in probability, logic, statistics, linguistics and computer science. A Venn diagram uses simple closed curves on a plane to represent sets. The curves are often circles or ellipses.
Similar ideas had been proposed before Venn such as by Christian Weise in 1712 (Nucleus Logicoe Wiesianoe) and Leonhard Euler in 1768 (Letters to a German Princess). The idea was popularised by Venn in Symbolic Logic, Chapter V "Diagrammatic Representation", published in 1881.
Remove ads
Details
Summarize
Perspective
A Venn diagram, also called a set diagram or logic diagram, shows all possible logical relations between a finite collection of different sets. These diagrams depict elements as points in the plane, and sets as regions inside closed curves. A Venn diagram consists of multiple overlapping closed curves, usually circles, each representing a set. The points inside a curve labelled S represent elements of the set S, while points outside the boundary represent elements not in the set S. This lends itself to intuitive visualizations; for example, the set of all elements that are members of both sets S and T, denoted S ∩ T and read "the intersection of S and T", is represented visually by the area of overlap of the regions S and T.[1]
In Venn diagrams, the curves are overlapped in every possible way, showing all possible relations between the sets. They are thus a special case of Euler diagrams, which do not necessarily show all relations. Venn diagrams were conceived around 1880 by John Venn. They are used to teach elementary set theory, as well as illustrate simple set relationships in probability, logic, statistics, linguistics, and computer science.
A Venn diagram in which the area of each shape is proportional to the number of elements it contains is called an area-proportional (or scaled) Venn diagram.
Remove ads
Example
Summarize
Perspective

This example involves two sets of creatures, represented as overlapping circles: one circle that represents all types of creatures that have two legs, and another representing creatures that can fly. Each separate type of creature can be imagined as a point somewhere in the diagram. Living creatures that have two legs and can fly—for example, parrots—are then in both sets, so they correspond to points in the region where the two circles overlap. This overlapping region would only contain those elements (in this example, creatures) that are members of both the set of two-legged creatures and set of flying creatures.
Humans and penguins are bipedal, and so are in the "has two legs" circle, but since they cannot fly, they appear in the part of the that circle that does not overlap with the "can fly" circle. Mosquitoes can fly, but have six, not two, legs, so the point for mosquitoes is in the part of the "can fly" circle that does not overlap with the "has two legs" circle. Creatures that are neither two-legged nor able to fly (for example, whales and spiders) would all be represented by points outside both circles.
The combined region of the two sets is called their union, denoted by A ∪ B, where A is the "has two legs" circle and B the "can fly" circle. The union in this case contains all living creatures that either are two-legged or can fly (or both). The region included in both A and B, where the two sets overlap, is called the intersection of A and B, denoted by A ∩ B.
Remove ads
History
Summarize
Perspective

Venn diagrams were introduced in 1880 by John Venn in a paper entitled "On the Diagrammatic and Mechanical Representation of Propositions and Reasonings"[2] in the Philosophical Magazine and Journal of Science,[3] about the different ways to represent propositions by diagrams.[4][5][6] The use of these types of diagrams in formal logic, according to Frank Ruskey and Mark Weston, predates Venn but are "rightly associated" with him as he "comprehensively surveyed and formalized their usage, and was the first to generalize them".[7]
Diagrams of overlapping circles representing unions and intersections were introduced by Catalan philosopher Ramon Llull (c. 1232–1315/1316) in the 13th century, who used them to illustrate combinations of basic principles.[8] Gottfried Wilhelm Leibniz (1646–1716) produced similar diagrams in the 17th century (though much of this work was unpublished), as did Johann Christian Lange in a work from 1712 describing Christian Weise's contributions to logic.[9][8] Euler diagrams, which are similar to Venn diagrams but don't necessarily contain all possible unions and intersections, were first made prominent by mathematician Leonhard Euler in the 18th century.[note 1][10][11]
Venn did not use the term "Venn diagram" and referred to the concept as "Eulerian Circles".[6] He became acquainted with Euler diagrams in 1862 and wrote that Venn diagrams did not occur to him "till much later", while attempting to adapt Euler diagrams to Boolean logic.[12] In the opening sentence of his 1880 article Venn wrote that Euler diagrams were the only diagrammatic representation of logic to gain "any general acceptance".[4][5]
Venn viewed his diagrams as a pedagogical tool, analogous to verification of physical concepts through experiment. As an example of their applications, he noted that a three-set diagram could show the syllogism: 'All A is some B. No B is any C. Hence, no A is any C.'[12]
Charles L. Dodgson (Lewis Carroll) includes "Venn's Method of Diagrams" as well as "Euler's Method of Diagrams" in an "Appendix, Addressed to Teachers" of his book Symbolic Logic (4th edition published in 1896). The term "Venn diagram" was later used by Clarence Irving Lewis in 1918, in his book A Survey of Symbolic Logic.[7][13]
In the 20th century, Venn diagrams were further developed. David Wilson Henderson showed, in 1963, that the existence of an n-Venn diagram with n-fold rotational symmetry implied that n was a prime number.[14] He also showed that such symmetric Venn diagrams exist when n is five or seven. In 2002, Peter Hamburger found symmetric Venn diagrams for n = 11 and in 2003, Griggs, Killian, and Savage showed that symmetric Venn diagrams exist for all other primes. These combined results show that rotationally symmetric Venn diagrams exist, if and only if n is a prime number.[15]
Venn diagrams and Euler diagrams were incorporated as part of instruction in set theory, as part of the new math movement in the 1960s. Since then, they have also been adopted in the curriculum of other fields such as reading.[16]
Remove ads
Popular culture
Venn diagrams have been commonly used in memes.[17] At least one politician has been mocked for misusing Venn diagrams.[18]
Overview
Summarize
Perspective
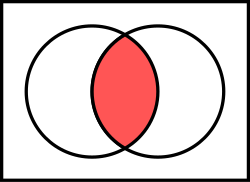 Intersection of two sets
 Union of two sets
 Symmetric difference of two sets
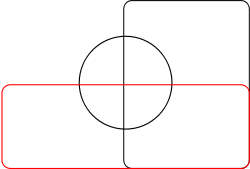
 Relative complement of A (left) in B (right)
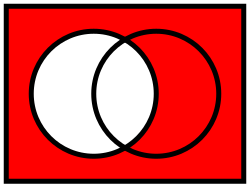 Absolute complement of A in U


A Venn diagram is constructed with a collection of simple closed curves drawn in a plane. According to Lewis,[13] the "principle of these diagrams is that classes [or sets] be represented by regions in such relation to one another that all the possible logical relations of these classes can be indicated in the same diagram. That is, the diagram initially leaves room for any possible relation of the classes, and the actual or given relation, can then be specified by indicating that some particular region is null or is not-null".[13]: 157
Venn diagrams normally comprise overlapping circles. The interior of the circle symbolically represents the elements of the set, while the exterior represents elements that are not members of the set. For instance, in a two-set Venn diagram, one circle may represent the group of all wooden objects, while the other circle may represent the set of all tables. The overlapping region, or intersection, would then represent the set of all wooden tables. Shapes other than circles can be employed as shown below by Venn's own higher set diagrams. Venn diagrams do not generally contain information on the relative or absolute sizes (cardinality) of sets. That is, they are schematic diagrams generally not drawn to scale.
Venn diagrams are similar to Euler diagrams. However, a Venn diagram for n component sets must contain all 2n hypothetically possible zones, that correspond to some combination of inclusion or exclusion in each of the component sets.[19] Euler diagrams contain only the actually possible zones in a given context. In Venn diagrams, a shaded zone may represent an empty zone, whereas in an Euler diagram, the corresponding zone is missing from the diagram. For example, if one set represents dairy products and another cheeses, the Venn diagram contains a zone for cheeses that are not dairy products. Assuming that in the context cheese means some type of dairy product, the Euler diagram has the cheese zone entirely contained within the dairy-product zone—there is no zone for (non-existent) non-dairy cheese. This means that as the number of contours increases, Euler diagrams are typically less visually complex than the equivalent Venn diagram, particularly if the number of non-empty intersections is small.[20]
The difference between Euler and Venn diagrams can be seen in the following example. Take the three sets:


The Euler and the Venn diagram of those sets are:
 Euler diagram
 Venn diagram


Remove ads
Extensions to higher numbers of sets
Summarize
Perspective
Venn diagrams typically represent two or three sets, but there are forms that allow for higher numbers. Shown below, four intersecting spheres form the highest order Venn diagram that has the symmetry of a simplex and can be visually represented. The 16 intersections correspond to the vertices of a tesseract (or the cells of a 16-cell, respectively).
 |

|

|

|
 |
For higher numbers of sets, some loss of symmetry in the diagrams is unavoidable. Venn was keen to find "symmetrical figures ... elegant in themselves,"[10] that represented higher numbers of sets, and he devised an elegant four-set diagram using ellipses (see below). He also gave a construction for Venn diagrams for any number of sets, where each successive curve that delimits a set interleaves with previous curves, starting with the three-circle diagram.
 Venn's construction for four sets (use Gray code to compute, the digit 1 means in the set, and the digit 0 means not in the set)
 Venn's construction for five sets
 Venn's construction for six sets
 Venn's four-set diagram using ellipses
 Non-example: This Euler diagram is not a Venn diagram for four sets as it has only 14 regions as opposed to 24 = 16 regions (including the white region); there is no region where only the yellow and blue, or only the red and green circles meet.
 Five-set Venn diagram using congruent ellipses in a five-fold rotationally symmetrical arrangement devised by Branko Grünbaum. Labels have been simplified for greater readability; for example, A denotes A ∩ Bc ∩ Cc ∩ Dc ∩ Ec, while BCE denotes Ac ∩ B ∩ C ∩ Dc ∩ E.
 Six-set Venn diagram made of only triangles (interactive version)


Edwards–Venn diagrams
 Three sets
 Four sets
 Five sets
 Six sets


Anthony William Fairbank Edwards constructed a series of Venn diagrams for higher numbers of sets by segmenting the surface of a sphere, which became known as Edwards–Venn diagrams.[21] For example, three sets can be easily represented by taking three hemispheres of the sphere at right angles (x = 0, y = 0 and z = 0). A fourth set can be added to the representation, by taking a curve similar to the seam on a tennis ball, which winds up and down around the equator, and so on. The resulting sets can then be projected back to a plane, to give cogwheel diagrams with increasing numbers of teeth—as shown here. These diagrams were devised while designing a stained-glass window in memory of Venn.[21]
Other diagrams
Edwards–Venn diagrams are topologically equivalent to diagrams devised by Branko Grünbaum, which were based around intersecting polygons with increasing numbers of sides. They are also two-dimensional representations of hypercubes.
Henry John Stephen Smith devised similar n-set diagrams using sine curves[21] with the series of equations

Charles Lutwidge Dodgson (also known as Lewis Carroll) devised a five-set diagram known as Carroll's square. Joaquin and Boyles, on the other hand, proposed supplemental rules for the standard Venn diagram, in order to account for certain problem cases. For instance, regarding the issue of representing singular statements, they suggest to consider the Venn diagram circle as a representation of a set of things, and use first-order logic and set theory to treat categorical statements as statements about sets. Additionally, they propose to treat singular statements as statements about set membership. So, for example, to represent the statement "a is F" in this retooled Venn diagram, a small letter "a" may be placed inside the circle that represents the set F.[22]
Remove ads
Related concepts

Venn diagrams correspond to truth tables for the propositions , , etc., in the sense that each region of Venn diagram corresponds to one row of the truth table.[23][24] This type is also known as Johnston diagram. Another way of representing sets is with John F. Randolph's R-diagrams.


Remove ads
See also
- Existential graph (by Charles Sanders Peirce)
- Logical connective
- Information diagram
- Marquand diagram (and as further derivation Veitch chart and Karnaugh map)
- Spherical octahedron – A stereographic projection of a regular octahedron makes a three-set Venn diagram, as three orthogonal great circles, each dividing space into two halves.
- Stanhope Demonstrator
- Three circles model
- Triquetra
- Vesica piscis
- UpSet plot
Remove ads
Notes
- In Euler's Lettres à une princesse d'Allemagne sur divers sujets de physique et de philosophie [Letters to a German Princess on various physical and philosophical subjects] (Saint Petersburg, Russia: l'Academie Impériale des Sciences, 1768), volume 2, pages 95-126. In Venn's article, however, he suggests that the diagrammatic idea predates Euler, and is attributable to Christian Weise or Johann Christian Lange (in Lange's book Nucleus Logicae Weisianae (1712)).
References
Further reading
External links
Wikiwand - on
Seamless Wikipedia browsing. On steroids.
Remove ads