1997 Canadian federal election

From Wikipedia, the free encyclopedia

1997 Canadian federal election

The 1997 Canadian federal election was held on June 2, 1997, to elect members to the House of Commons of the 36th Parliament of Canada. Prime Minister Jean Chrétien's Liberal Party won a second majority government. The Reform Party replaced the Bloc Québécois as the Official Opposition.

Quick Facts 301 seats in the House of Commons 151 seats needed for a majority, Turnout ...
1997 Canadian federal election

 1993 June 2, 1997 (1997-06-02) 2000 

301 seats in the House of Commons
151 seats needed for a majority
Opinion polls
Turnout67.0% (3.9pp)
  First party Second party Third party
 
Thumb
Thumb
Thumb
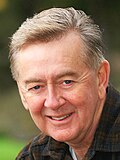
Leader Jean Chrétien Preston Manning Gilles Duceppe
Party Liberal Reform Bloc Québécois
Leader since June 23, 1990 November 1, 1987 March 15, 1997
Leader's seat Saint-Maurice Calgary Southwest Laurier—
Sainte-Marie
Last election 177 seats, 41.24% 52 seats, 18.69% 54 seats, 13.52%
Seats before 174 50 50
Seats won 155 60 44
Seat change 19 10 6
Popular vote 4,994,277 2,513,080 1,385,821
Percentage 38.46% 19.35% 10.67%[i]
Swing 2.78pp 0.66pp 2.85pp

  Fourth party Fifth party
 
Thumb
Thumb
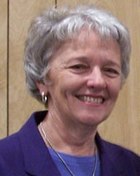
Leader Alexa McDonough Jean Charest
Party New Democratic Progressive Conservative
Leader since October 14, 1995 April 29, 1995
Leader's seat Halifax Sherbrooke
Last election 9 seats, 6.88% 2 seats, 16.04%
Seats before 9 2
Seats won 21 20
Seat change 12 18
Popular vote 1,434,509 2,446,705
Percentage 11.05% 18.84%
Swing 4.17pp 2.80pp

Thumb
Thumb

Thumb
The Canadian parliament after the 1997 election

Prime Minister before election

Jean Chrétien
Liberal

Prime Minister after election

Jean Chrétien
Liberal

Close

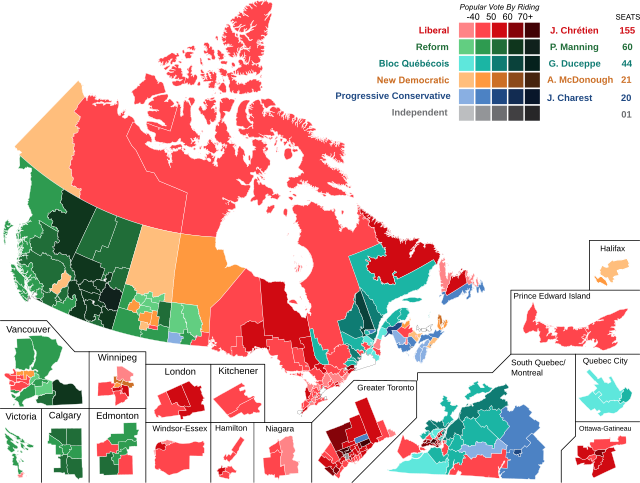
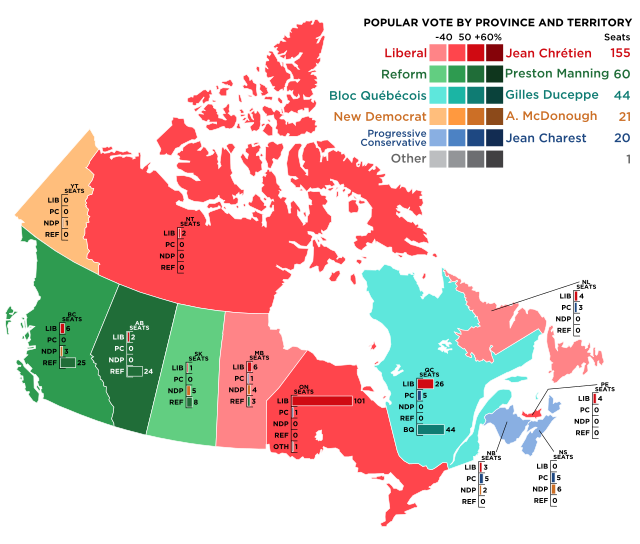
The election results closely followed the pattern of the 1993 election. The Liberals swept Ontario, while the Bloc won a majority in Quebec. Reform made sufficient gains in the West to allow Preston Manning to become leader of the Official Opposition, but lost its only seat east of Manitoba. The most significant change was major gains in Atlantic Canada by the New Democratic Party (NDP) and the rump Progressive Conservative Party. The Liberal victory was not in doubt, though some commentators on election night were predicting that the party would be cut down to a minority government and that Chrétien might lose his seat. Chrétien narrowly won his riding, and the Liberals maintained a narrow five-seat majority thanks to gains in Quebec at the expense of the Bloc. Jean Charest's Tories and Alexa McDonough's NDP both regained official party status in the House of Commons.

This was the first time that five political parties held official party status in a single session of Canada's Parliament, and the only time to date that five different parties have won the popular vote in at least one of the provinces and territories of Canada.

Background

Summarize
Perspective

Prime Minister Jean Chrétien announced his approved request by Governor General Roméo LeBlanc to dissolve Parliament on April 26, 1997, with an election to be held on June 2 of that year. Chrétien's election call came three years and five months into Parliament's life, short of both the maximum five year duration and the typical four years between elections. This represented the earliest election call in a majority Parliament since the 1911 election.[1] Opinion polls at the time predicted that the Liberal Party was expected to win a landslide victory capturing at least 180 to 220 of the 301 seats in the House of Commons, with the fragmentation of the opposition meaning that one party was not expected to be able to defeat the government.[1]

The election call was controversial both for being early and for occurring during Manitoba's recovery from the Red River Flood earlier in the year. Reg Alcock and several others inside the Liberal Party had opposed the timing of the vote, and the poor results prompted Paul Martin's supporters to organize against Chrétien.

The election was the first to be held with staggered polling hours across the country. Until 1993, polling hours were 9 a.m. to 8 p.m. in each time zone, with a 4.5-hour difference between closing of polls in Newfoundland and those in British Columbia and Yukon, or a three-hour difference between Quebec-Ontario and B.C.-Yukon. With the new staggered hours, it would be three hours between Newfoundland and B.C.-Yukon, but just 30 minutes between Quebec-Ontario and B.C.-Yukon.

Political Parties

Summarize
Perspective

Liberal Party

Thumb
Liberal Party logo during the election.

The Liberal Party under Jean Chrétien campaigned on promising to continue to cut the federal deficit to allow for a budget surplus, and then to spend one half of the surplus on repaying Canada's national debt and cutting taxes while the other half of the surplus would be used to increase funding to health care, assistance for Canadian children in poverty, and job creation.[2] The platform was called Securing Our Future Together.[3] The Liberal Party was attacked by the opposition parties for failing to keep many of the promises that the party campaigned on in the 1993 federal election.[4] The Liberals attacked the Progressive Conservatives and the Reform Party for prematurely calling for tax cuts while a deficit still remained while attacking the New Democratic Party for proposing to increase government spending while Canada faced a deficit.[4]

The Liberals suffered from a number of gaffes in their campaign. In one incident, when Jean Chrétien was questioned by reporters over the cost of the Liberals' election proposal of a national pharmacare program, reporters claimed that Chrétien was unsure of what the cost would be.[4] Chrétien also turned down invitations for interviews by Canada's national media outlets, the Canadian Broadcasting Corporation (CBC) and MuchMusic.[4] In the televised debates between the five major political parties, Chrétien apologized to Canadians for his government having cut funding for social programs to reduce the deficit.[4]

On election day, the Liberals won with a significantly reduced majority. While they lost much of their support in Atlantic Canada, they won all but two seats in Ontario and improved on their numbers in Quebec. They were only assured of a majority when the final numbers came in from Western Canada.

Reform Party

Thumb
Logo of the Reform Party during the election.

The Reform Party under Preston Manning campaigned on preserving national unity through decentralization of multiple federal government powers to all of the provinces, cutting taxes, reducing the size of government, reducing spending, and strongly opposing distinct society status for Quebec. Feeling that the general acceptance of deficit reduction at the federal and provincial level had been encouraged by their party, Reform saw a chance to finally make the party a national in scope by making political inroads outside of the west, particularly in Ontario.[5][6] Their platform was titled the Fresh Start for all Canadians.[7] The Reformers ran a full slate of candidates in Quebec, making this the first and last election in which it would run candidates in every region of Canada.

Reform's campaign ran into multiple problems. The party was repeatedly accused by other parties and the media of holding intolerant views due to comments made by a number of Reform MPs during the writ period.[5] Critics had accused the party's performance during the 1993–1997 parliament of being disorganized.[4] Tension between the party's democratic nature and the leader-centric model of modern campaigning led to Manning's leadership abilities being questioned by a number of former members, including Stephen Harper, who accused Manning of inappropriately using a Can$31,000 personal expense allowance as leader.[8] Some Reform supporters were frustrated by the party's decision to expand its political base into Quebec, as they continued to believe that the party should represent English-speaking Canada, and others from the right-wing and populist faction of the party were angry that Manning punished MPs Bob Ringma and David Chatters for outbursts.[9] During the campaign the Reform Party released a controversial television advertisement where the faces of four Quebecers, Prime Minister Jean Chrétien, Bloc Québécois leader Gilles Duceppe, Progressive Conservative leader Jean Charest, and Premier of Quebec Lucien Bouchard, were crossed out, followed by a message saying that Quebec politicians had dominated the federal government for too long and that the Reform Party would end this favoritism towards Quebec.[10] The advertisement was harshly criticized by the other party leaders including accusations that Manning was "intolerant" and a "bigot" for having permitted the advertisement to be aired.[10]

Reform began the campaign with Can$1.5 million in cash on hand, and had raised a total of Can$8 million. In contrast to the other parties, the vast majority of the money came from donations by individuals or small businesses.[11]

The results for Reform were a generally considered a minor tactical success. The party won 60 seats to displace the Bloc as Official Opposition, largely by building on its already heavy concentration of support in Western Canada. Strategically, Reform failed to make inroads into eastern Canada and lost its one seat in Ontario, leaving it effectively perceived as a Western regional party, despite making their first significant inroads into rural Ontario.

Bloc Québécois

Thumb
Logo of the Bloc Québécois during the election.

The Bloc Québécois, under the leadership of Gilles Duceppe, lost its position of Official Opposition, falling to third place. The party's founding leader, Lucien Bouchard, had resigned in the aftermath of the 1995 Quebec referendum in order to become Premier of Quebec. Bouchard had been replaced by Michel Gauthier, but a lack of direction and party infighting caused their poll numbers to plummet, leaving them in danger of being overhauled by both the Liberals and the resurgent Progressive Conservatives. Duceppe, who took over as leader after Gauthier resigned, nonetheless made progress by emphasizing the lack of possibility of constitutional reform. While the party only finished 1.2 percentage points ahead of the Liberals in the province's popular vote, a more efficiently-distributed vote (the Liberal vote was too concentrated in and around Montreal; elsewhere, they split the vote with the Progressive Conservatives) still allowed them capture a comfortable majority of 44 out of Quebec's 75 seats.

New Democratic Party

Thumb
Logo of the New Democratic Party during the election.

The New Democratic Party under the leadership of Alexa McDonough regained official party status that the party lost in the 1993 Canadian federal election. The party won the fourth largest share of total votes and won 21 seats. Notably, the party made a substantial showing in Atlantic Canada, a region where it had only elected three MPs in its entire history prior to the election.

Progressive Conservative Party

Thumb
Logo of the Progressive Conservative Party during the election.

The Progressive Conservative Party under Jean Charest campaigned on securing national unity in Canada by recognizing Quebec as being a distinct society within Canada, along with the proposal of a "New Covenant" for Canadian confederation to be negotiated between the Federal and Provincial governments.[12] The party's platform included the novelty of being publicly distributed on CD-ROM. Charest and the PCs benefited from rapidly rising in popularity amongst all language groups in Quebec, where voters were found to have preferred Charest over Gilles Duceppe, the leader of the Bloc Québécois.[13]

The Progressive Conservatives faced multiple difficulties, as the party was not able to apply for federal financial assistance due to it not being an official party. The party's results in their previous bastion of Western Canada remained anemic, and the Reformers remained the dominant conservative political force in the west. Reform also made inroads into rural central and southern Ontario — traditionally the heartland of the Tories' provincial counterparts.

The Progressive Conservatives won the third largest number of the total votes and improved their situation in the House of Commons, regaining official party status after winning 20 seats. Despite finishing about half a point behind Reform in the nationwide popular vote, their only heavy concentrations of support were in Atlantic Canada and Quebec. Elsewhere, like in 1993, their support was too spread out to translate into victories in individual ridings. They only won one seat each in Ontario and Manitoba, and none west of Manitoba. The result, a disappointment for Charest, would lead to his resignation and eventual assumption of leadership of the Liberal Party of Quebec.

Green Party

Support for the Green Party of Canada was 79% higher than at the previous election, with its greatest success in British Columbia, where it received 2% of the vote. The Green Party remained almost entirely off the national media's radar. At 0.43% of the vote, and 1.64% of the vote in the ridings it contested, the Green Party remained a small but growing movement.

Results

Summarize
Perspective
Thumb
More information Party, Party Leader ...
Summary of the 1997 House of Commons of Canada election results
Party Party Leader Candidates Seats Popular vote
1993 Dissol. Elected % Change # % Change
Liberal Jean Chrétien 301 177 174 155 -12.4% 4,994,277 38.46% -2.78pp
Reform Preston Manning 227 52 50 60 +15.4% 2,513,080 19.35% +0.66pp
Bloc Québécois Gilles Duceppe 75 54 50 44 -18.5% 1,385,821 10.67% -2.85pp
New Democratic Alexa McDonough 301 9 9 21 +133.3% 1,434,509 11.05% +4.17pp
Progressive Conservative Jean Charest 301 2 2 20 +900% 2,446,705 18.84% +2.80pp
  Independent and No Affiliation 76 1 6 1   60,759 0.47% -0.09pp
Green Joan Russow 79 - - - - 55,583 0.43% +0.18pp
Natural Law Neil Paterson 136 - - - - 37,085 0.29% +x
Christian Heritage Ron Gray 53 - - - - 29,085 0.22% +x
Canadian Action Paul T. Hellyer 58 * - - * 17,502 0.13% *
Marxist–Leninist Hardial Bains 65 - - - - 11,468 0.09% +0.05pp
  Vacant 4  
Total 1,672 295 295 301 +2.0% 12,985,874 100%  
Sources: http://www.elections.ca History of Federal Ridings since 1867
Close

Notes:

*: Party did not nominate candidates in the previous election.

x: Less than 0.005% of the popular vote

Vote and seat summaries

More information Popular vote ...
Popular vote
Liberal
38.46%
Reform
19.35%
PC
18.84%
NDP
11.05%
Bloc Québécois
10.67%
Green
0.43%
Others
1.20%
Close
More information Seat totals ...
Seat totals
Liberal
51.50%
Reform
19.93%
Bloc Québécois
14.62%
NDP
6.98%
PC
6.64%
Independents
0.33%
Close

Synopsis of results

  = Newly created constituency
  = Open seat
  = Turnout is above national average
  = Winning candidate held seat in previous House
  = Incumbent had switched allegiance
  = Previously incumbent in another riding
  = Not incumbent; was previously elected to the House
  = Incumbency arose from byelection gain
  = Other incumbents renominated
  = Previously a member of one of the provincial legislatures
  = Multiple candidates
More information Riding, Winning party ...
Results by riding — 1997 Canadian federal election[14][15][a 1]
Riding Winning party Turnout
[a 2]
Votes[a 3]
1st place Votes Share Margin
#
Margin
%
2nd place Lib Ref PC NDP BQ Green NLP CHP Ind Other Total
 
AthabascaAB  Ref 14,67354.62%6,60724.59%  Lib 49.4%8,06614,6732,4591,26240526,865
Calgary CentreAB  Ref 19,93640.08%3,7057.45%  Lib 57.9%16,23119,9369,2303,01189327316749,741
Calgary EastAB  Ref 13,34844.98%6,04220.36%  PC 47.9%6,76613,3487,3061,92632929,675
Calgary NortheastAB  Ref 18,71952.11%10,07328.04%  Lib 50.9%8,64618,7195,8151,2092311,30035,920
Calgary SoutheastAB  Ref 24,60255.02%14,03531.39%  PC 63.7%8,13124,60210,5671,17623544,711
Calgary SouthwestAB  Ref 27,91257.99%18,20637.83%  Lib 66.8%9,70627,9128,617[a 4]1,3223101758948,131
Calgary WestAB  Ref 24,87847.20%9,60118.22%  Lib 64.7%15,27724,8789,5942,10555729352,704
Calgary—Nose HillAB  Ref 25,78851.80%13,22326.56%  Lib 64.9%12,56525,7888,6781,88363723749,788
CrowfootAB  Ref 30,58970.99%23,91055.49%  PC 64.1%4,18530,5896,6791,63543,088
Edmonton EastAB  Ref 15,47544.58%3,47010.00%  Lib 51.7%12,00515,4752,5354,09621110728734,716
Edmonton NorthAB  Ref 16,12444.30%4,30411.83%  Lib 55.6%11,82016,1242,8115,41322636,394
Edmonton SoutheastAB  Lib 14,74545.98%1,4504.52%  Ref 56.0%14,74513,2951,9941,88215232,068
Edmonton SouthwestAB  Ref 22,69751.34%7,86417.79%  Lib 62.6%14,83322,6974,4032,07020544,208
Edmonton WestAB  Lib 17,80243.45%1,4103.44%  Ref 54.4%17,80216,3922,9193,38621014312240,974
Edmonton—StrathconaAB  Ref 20,60541.30%2,9515.92%  Lib 62.7%17,65420,6053,6147,2514061531159249,890
Elk IslandAB  Ref 26,27660.64%17,74040.94%  Lib 62.9%8,53626,2765,4162,54455943,331
LakelandAB  Ref 23,21459.28%16,23841.47%  PC 56.6%6,91123,2146,9761,73732139,159
LethbridgeAB  Ref 22,82855.53%14,94136.35%  Lib 59.7%7,88722,8287,4362,21141832641,106
MacleodAB  Ref 24,22568.02%18,67052.42%  PC 56.6%4,13724,2255,5551,44425335,614
Medicine HatAB  Ref 22,76165.45%16,68247.97%  Lib 53.6%6,07922,7614,2191,71934,778
Peace RiverAB  Ref 22,35158.94%15,11039.84%  Lib 53.6%7,24122,3516,1042,22637,922
Red DeerAB  Ref 28,62268.38%22,05652.69%  PC 57.4%4,78528,6226,5661,66022741,860
St. AlbertAB  Ref 24,26955.19%11,73226.68%  Lib 61.9%12,53724,2694,6452,17235443,977
WetaskiwinAB  Ref 26,44365.96%20,75151.76%  Lib 61.0%5,69226,4435,2821,94073440,091
Wild RoseAB  Ref 28,56963.79%20,06344.79%  PC 60.5%5,42828,5698,5061,59469244,789
YellowheadAB  Ref 22,96064.82%16,64246.98%  Lib 56.9%6,31822,9604,3831,75935,420
Burnaby—DouglasBC  NDP 19,05843.08%7,31516.54%  Ref 68.1%11,53611,7431,49819,05830010344,238
Cariboo—ChilcotinBC  Ref 16,00851.11%9,51530.38%  Lib 61.0%6,49316,0083,7074,40670731,321
Delta—South RichmondBC  Ref 23,89146.50%4,8209.38%  Lib 68.8%19,07123,8912,8294,71524532530851,384
Dewdney—AlouetteBC  Ref 20,44647.26%9,58522.15%  Lib 63.0%10,86120,4462,6198,29663419521543,266
Esquimalt—Juan de FucaBC  Ref 20,37043.43%8,09217.25%  Lib 65.0%12,27820,3702,10410,4001,18131126146,905
Fraser ValleyBC  Ref 33,10162.85%21,53240.88%  Lib 67.0%11,56933,1011,7144,6803421181,0479552,666
KamloopsBC  NDP 16,13836.07%1,8944.23%  Lib 67.3%14,24412,92899916,13843744,746
KelownaBC  Ref 25,24650.01%13,94027.62%  Lib 62.8%11,30625,2468,4773,8381,61250,479
Kootenay—ColumbiaBC  Ref 22,38761.91%16,01444.29%  Lib 64.9%6,37322,3871,4795,13378636,158
Langley—AbbotsfordBC  Ref 31,66462.02%18,93137.08%  Lib 67.3%12,73331,6641,8003,41879015149551,051
Nanaimo—AlberniBC  Ref 25,06949.86%13,90727.66%  NDP 67.1%10,51325,0692,60211,16265028250,278
Nanaimo—CowichanBC  Ref 22,68544.95%9,57318.97%  NDP 65.2%10,66322,6852,13113,11292822472050,463
New Westminster—Coquitlam—BurnabyBC  Ref 15,91534.47%1,8484.00%  NDP 65.4%13,43715,9151,80314,0676911609346,166
North VancouverBC  Ref 27,07548.86%8,26914.92%  Lib 71.8%18,80627,0752,7405,07598216236520355,408
Okanagan—CoquihallaBC  Ref 24,57053.06%12,32926.63%  Lib 65.1%12,24124,5702,5235,4411,00831820246,303
Okanagan—ShuswapBC  Ref 24,95253.13%13,36728.46%  Lib 67.1%11,58524,9523,1605,83962780246,965
Port Moody—CoquitlamBC  Ref 23,11343.61%7,47714.11%  Lib 66.5%15,63623,1132,92710,44469519053,005
Prince George–Bulkley ValleyBC  Ref 17,50554.28%10,43532.36%  Lib 58.0%7,07017,5052,6153,93550730031532,247
Prince George—Peace RiverBC  Ref 22,27066.91%16,58749.84%  Lib 57.5%5,68322,2701,9112,98942933,282
RichmondBC  Lib 18,16543.81%3,2537.85%  Ref 64.9%18,16514,9123,4353,9645651641679041,462
Saanich—Gulf IslandsBC  Ref 24,27543.07%6,53311.59%  Lib 74.3%17,74224,2754,2438,0801,54624823456,368
SkeenaBC  Ref 13,40242.35%3,53911.18%  NDP 63.7%6,40813,4021,1069,86386431,643
South Surrey—White Rock—LangleyBC  Ref 25,14154.87%11,33124.73%  Lib 71.4%13,81025,1412,0683,61675612916913045,819
Surrey CentralBC  Ref 17,46134.67%2,8665.69%  Lib 61.6%14,59517,4614,3277,0644171479784,73663450,359
Surrey North[a 5]BC  Ref 16,15846.80%6,43518.64%  Lib 61.0%9,72316,1581,0936,5792807029120012934,523
Vancouver CentreBC  Lib 20,87840.76%9,31118.18%  Ref 64.7%20,87811,5674,73610,6901,54121794564451,218
Vancouver EastBC  NDP 14,96142.25%1,8385.19%  Lib 59.9%13,1234,28796414,9611,22118522628215835,407
Vancouver Island NorthBC  Ref 22,76947.54%11,61724.26%  NDP 64.4%10,02422,7691,65011,1521,55921852247,894
Vancouver KingswayBC  Lib 14,18240.62%3,52010.08%  NDP 63.4%14,1826,4121,38510,6628112101,08816134,911
Vancouver QuadraBC  Lib 18,84742.14%6,50714.55%  Ref 67.8%18,84712,3407,5464,4861,15521113544,720
Vancouver South—BurnabyBC  Lib 16,64842.66%5,05012.94%  Ref 64.2%16,64811,5982,3217,46763322413839,029
VictoriaBC  Lib 18,13034.76%2,7375.25%  Ref 68.5%18,13015,3933,58911,4192,80634013135352,161
West Kootenay—OkanaganBC  Ref 18,95446.78%10,08524.89%  NDP 66.7%7,07818,9542,2558,8692,45518734037740,515
West Vancouver—Sunshine CoastBC  Ref 20,09240.05%2,7745.53%  Lib 66.8%17,31820,0924,1945,9882,31825450,164
Brandon—SourisMB  PC 13,21635.59%1,3333.59%  Ref 66.9%6,58311,88313,2164,98322924437,138
Charleswood—AssiniboineMB  Lib 15,92542.97%7,26119.59%  PC 67.6%15,9258,3988,6643,92315437,064
ChurchillMB  NDP 9,61641.17%2,76411.83%  Lib 50.2%6,8524,4382,4529,61623,358
Dauphin—Swan RiverMB  Ref 12,66835.49%4,95213.87%  PC 65.4%7,40812,6687,7167,57532635,693
Portage—LisgarMB  Ref 13,53240.25%1,4494.31%  PC 60.6%4,91313,53212,0832,42051715933,624
ProvencherMB  Lib 14,59540.00%1,7974.93%  Ref 64.9%14,59512,7985,9553,13736,485
Saint BonifaceMB  Lib 18,94851.22%12,28533.21%  NDP 65.9%18,9486,6584,5556,66317136,995
Selkirk—InterlakeMB  Ref 10,93728.30%660.17%  Lib 65.5%10,87110,9375,73010,74936338,650
Winnipeg CentreMB  NDP 10,97940.89%1,0844.04%  Lib 57.0%9,8953,0952,44210,97930013626,847
Winnipeg North CentreMB  NDP 13,66350.27%5,86221.57%  Lib 57.6%7,8013,6781,74213,66316912827,181
Winnipeg North—St. PaulMB  Lib 13,52437.48%4,03711.19%  NDP 66.0%13,5247,1085,4309,4874429236,083
Winnipeg SouthMB  Lib 18,80049.57%11,29029.77%  Ref 67.4%18,8007,5106,5474,6291531919437,924
Winnipeg South CentreMB  Lib 20,00655.89%14,28939.92%  NDP 64.9%20,0064,4575,0115,71722420218035,797
Winnipeg—TransconaMB  NDP 16,64050.27%9,53528.80%  Lib 60.4%7,1055,7032,96816,64042316110433,104
Acadie—BathurstNB  NDP 21,11340.53%2,6925.17%  Lib 78.6%18,42112,56021,11352,094
Beauséjour—PetitcodiacNB  NDP 18,50438.99%1,9754.16%  Lib 75.9%16,5294,8337,59218,50447,458
CharlotteNB  PC 14,53344.95%6,22419.25%  Lib 73.2%8,3096,81414,5332,39728032,333
FrederictonNB  Lib 12,25234.12%1,4173.95%  PC 67.2%12,2527,81510,8354,68932135,912
Fundy—RoyalNB  PC 16,71541.52%6,52316.20%  Lib 76.2%10,1929,22916,7153,79032940,255
Madawaska—RestigoucheNB  PC 20,34350.30%5,38613.32%  Lib 75.6%14,95720,3434,21193340,444
MiramichiNB  Lib 13,92440.45%3,3549.74%  PC 77.2%13,9244,66810,5705,26334,425
Moncton—Riverview—DieppeNB  Lib 20,86044.57%8,92919.08%  PC 70.4%20,8606,07311,9317,51042446,798
Saint JohnNB  PC 22,22763.11%16,61547.18%  Lib 67.0%5,6123,46722,2273,67923235,217
Tobique—MactaquacNB  PC 12,12535.90%1,9355.73%  Lib 72.0%10,1909,37112,1252,09333,779
Bonavista—Trinity—ConceptionNL  Lib 12,92935.25%5701.55%  NDP 54.2%12,92910,33212,3591,05436,674
Burin—St. George'sNL  PC 13,88445.70%2,1697.14%  Lib 54.7%11,71513,8844,78430,383
Gander—Grand FallsNL  Lib 13,40952.21%4,75718.52%  PC 44.1%13,4098,6523,62025,681
Humber—St. Barbe—Baie VerteNL  Lib 12,05739.83%2320.77%  PC 54.9%12,0571,96911,8254,42130,272
LabradorNL  Lib 6,18250.62%1,56712.83%  NDP 60.7%6,1825738424,61512,212
St. John's EastNL  PC 17,28638.98%4,82610.88%  NDP 58.8%12,0481,97717,28612,46038819144,350
St. John's WestNL  PC 19,39344.07%3,0766.99%  Lib 60.4%16,3171,11319,3936,86631944,008
Bras d'OrNS  NDP 17,57541.30%1,2172.86%  Lib 75.2%16,3588,62017,57542,553
Cumberland—ColchesterNS  PC 18,61043.63%7,60817.83%  Lib 69.8%11,0025,97018,6106,05819382642,659
DartmouthNS  NDP 12,32632.57%2,0285.36%  Lib 65.0%10,2984,44610,18312,32615643837,847
HalifaxNS  NDP 21,83749.02%11,47625.76%  PC 68.9%9,6382,42210,36121,8371978944,544
Halifax WestNS  NDP 16,01334.63%1,7293.74%  Lib 67.3%14,2844,84310,84816,0131797046,237
Kings—HantsNS  PC 17,40136.27%2,8866.02%  Lib 65.7%14,5156,42417,4019,10127825147,970
Pictou—Antigonish—GuysboroughNS  PC 18,19642.34%5,34512.44%  Lib 72.0%12,8513,41618,1968,28422842,975
Sackville—Musquodoboit Valley—Eastern ShoreNS  NDP 12,43330.37%410.10%  PC 66.6%10,7505,15512,39212,43321140,941
South ShoreNS  PC 14,13636.00%2,7396.97%  Lib 67.3%11,3975,30214,1368,13729839,270
Sydney—VictoriaNS  NDP 22,45551.10%10,88624.77%  Lib 74.3%11,5699,92022,45543,944
West NovaNS  PC 13,18734.31%3,3108.61%  Lib 73.9%9,8777,22913,1877,86227538,430
Algoma—ManitoulinON  Lib 13,81041.31%5,45716.33%  Ref 61.5%13,8108,3533,3677,89733,427
Barrie—Simcoe—BradfordON  Lib 23,54943.48%7,50713.86%  Ref 64.0%23,54916,04210,7352,58050642132754,160
Beaches—East YorkON  Lib 21,84447.93%11,11424.39%  NDP 67.3%21,8446,5345,61110,73058926445,572
Bramalea—Gore—MaltonON  Lib 18,93346.37%8,27820.27%  PC 61.0%18,9338,68510,6552,28127940,833
Brampton CentreON  Lib 18,61548.85%7,79820.47%  Ref 60.3%18,61510,8175,6212,92312738,103
Brampton West—MississaugaON  Lib 27,29759.99%18,85041.42%  PC 61.1%27,2977,5698,4472,19245,505
BrantON  Lib 24,12552.97%13,68930.06%  Ref 63.1%24,12510,4365,7815,20145,543
Broadview—GreenwoodON  Lib 21,10849.76%7,20516.98%  NDP 68.1%21,1083,2473,23813,9034262052118542,423
Bruce—GreyON  Lib 17,89636.79%1,7353.57%  Ref 68.8%17,89616,16111,1393,44648,642
BurlingtonON  Lib 22,04244.12%5,69811.40%  PC 70.0%22,0428,66216,3442,56135249,961
CambridgeON  Lib 17,67336.74%6,90614.36%  Ref 64.8%17,67310,7679,2999,81354848,100
Carleton—GloucesterON  Lib 29,86258.96%19,90239.29%  PC 74.3%29,8627,4049,9602,83134924450,650
DavenportON  Lib 17,19565.86%12,38847.45%  NDP 62.4%17,1952,6284,80755138454326,108
Don Valley EastON  Lib 25,39459.20%16,78439.13%  PC 66.0%25,3945,1678,6102,98119217038442,898
Don Valley WestON  Lib 26,20952.95%11,16322.55%  PC 72.3%26,2094,66915,0462,92237817310449,501
Dufferin—Peel—Wellington—GreyON  Lib 20,95742.63%6,19712.61%  Ref 66.9%20,95714,76011,0892,35549,161
DurhamON  Lib 19,87843.34%6,81914.87%  Ref 64.1%19,87813,0598,9953,25068245,864
Eglinton—LawrenceON  Lib 25,98559.24%16,00836.50%  PC 67.0%25,9853,5479,9773,95539743,861
Elgin—Middlesex—LondonON  Lib 17,89039.99%6,39114.29%  PC 64.3%17,89010,30711,4993,2605081,27544,739
Erie—LincolnON  Lib 17,54242.84%4,75411.61%  Ref 63.4%17,54212,7886,3172,5092281,30126740,952
EssexON  Lib 22,05246.07%7,87216.45%  NDP 62.8%22,0528,5453,08614,18047,863
Etobicoke CentreON  Lib 27,34554.56%16,32232.56%  PC 71.8%27,3458,63811,0232,66126718950,123
Etobicoke NorthON  Lib 22,23661.84%16,63946.27%  Ref 61.1%22,2365,5974,2763,35017432435,957
Etobicoke—LakeshoreON  Lib 21,18046.22%10,67123.28%  PC 67.6%21,1808,69710,5094,085315139903[a 6]45,828
Glengarry—Prescott—RussellON  Lib 34,98671.98%28,87759.41%  PC 68.7%34,9864,5996,1092,28941720748,607
Guelph—WellingtonON  Lib 25,00447.73%13,84426.43%  PC 66.6%25,0049,05411,1605,45658997214652,381
Haldimand—Norfolk—BrantON  Lib 21,04345.50%8,49518.37%  Ref 65.8%21,04312,5489,7042,51643746,248
HaltonON  Lib 26,01747.25%12,23922.23%  PC 67.8%26,01712,22113,7782,45260055,068
Hamilton EastON  Lib 16,99149.48%10,12129.47%  NDP 56.3%16,9915,7163,9136,87037631216034,338
Hamilton MountainON  Lib 21,12845.81%12,25126.56%  PC 63.6%21,1288,1548,8777,44052046,119
Hamilton WestON  Lib 20,95150.02%13,30331.76%  NDP 61.9%20,9516,2856,5107,64832317041,887
Hastings—Frontenac—Lennox and AddingtonON  Lib 18,39939.47%6,17213.24%  PC 67.8%18,39912,04512,2273,25518950546,620
Huron—BruceON  Lib 24,24051.35%14,31530.32%  Ref 70.4%24,2409,9259,2233,03778147,206
Kenora—Rainy RiverON  Lib 14,08441.93%4,30212.81%  Ref 60.6%14,0849,7822,7996,92233,587
Kent—EssexON  Lib 21,45150.20%12,51029.28%  Ref 59.3%21,4518,9416,6344,32329162147042,731
Kingston and the IslandsON  Lib 25,63249.51%14,33627.69%  PC 62.8%25,6326,76111,2966,43390275151,775
Kitchener CentreON  Lib 23,08948.00%12,12925.22%  PC 64.3%23,0899,55010,9604,50348,102
Kitchener—WaterlooON  Lib 25,11147.71%13,49825.65%  PC 62.6%25,11110,50211,6134,72526541352,629
Lambton—Kent—MiddlesexON  Lib 21,15546.24%8,55318.69%  Ref 65.6%21,15512,6027,2562,4402561,78525745,751
Lanark—CarletonON  Lib 28,15145.32%11,38618.33%  Ref 71.7%28,15116,76513,2133,02246318131862,113
Leeds—GrenvilleON  Lib 19,12339.47%3,4877.20%  PC 69.9%19,123[a 7]10,47615,6361,7571,10211924148,454
London North CentreON  Lib 23,89151.72%15,81934.25%  PC 60.2%23,8917,0168,0725,67968537533613846,192
London WestON  Lib 24,71048.55%13,75227.02%  PC 68.2%24,7108,83910,9585,2914975158350,893
London—FanshaweON  Lib 20,49751.20%13,65934.12%  Ref 58.7%20,4976,8385,4996,75444240,030
MarkhamON  PC 20,44944.70%3,6397.95%  Lib 67.5%16,8104,94720,4491,4822581,58421845,748
Mississauga CentreON  Lib 25,88165.04%19,83249.84%  PC 61.3%25,8815,7706,0491,90019239,792
Mississauga EastON  Lib 23,78059.95%15,92840.15%  PC 64.5%23,7805,6177,8522,15626239,667
Mississauga SouthON  Lib 21,20749.94%11,13026.21%  PC 65.9%21,2078,30710,0772,30219914122942,462
Mississauga WestON  Lib 30,59861.21%21,43842.89%  Ref 64.8%30,5989,1608,1022,12849,988
Nepean—CarletonON  Lib 28,36648.80%13,03322.42%  Ref 75.4%28,36615,33311,0722,78823833158,128
Niagara CentreON  Lib 24,11549.70%12,06224.86%  Ref 65.1%24,11512,0535,8275,51036351514348,526
Niagara FallsON  Lib 15,86838.36%4,88211.80%  Ref 63.6%15,86810,9869,9354,05237415441,369
Nickel BeltON  Lib 19,48948.85%6,13415.38%  NDP 68.1%19,4894,7711,76313,35514536939,892
NipissingON  Lib 19,78656.34%12,39635.29%  Ref 63.8%19,7867,3905,6662,28035,122
NorthumberlandON  Lib 21,18245.77%9,72421.01%  PC 65.1%21,18210,60211,4582,67835546,275
Oak RidgesON  Lib 27,39454.73%15,16230.29%  PC 64.2%27,3947,56812,2322,41128116750,053
OakvilleON  Lib 24,48747.68%9,01417.55%  PC 72.9%24,4879,05015,4732,34351,353
OshawaON  Lib 15,92537.72%3,9519.36%  Ref 58.6%15,92511,9746,9727,35042,221
Ottawa CentreON  Lib 25,98745.19%12,34121.46%  NDP 70.2%25,9876,6519,39113,64685521137338657,500
Ottawa SouthON  Lib 31,72559.01%23,20343.16%  Ref 72.3%31,7258,5228,1154,37444016742153,764
Ottawa West—NepeanON  Lib 29,51154.02%17,91032.78%  Ref 72.7%29,51111,6018,4894,1634161532119054,634
Ottawa—VanierON  Lib 30,72861.87%23,97448.27%  PC 66.8%30,7284,8686,7545,95265133024113849,662
OxfordON  Lib 16,28135.98%1,5753.48%  PC 66.9%16,2819,53314,7063,40618195619245,255
Parkdale—High ParkON  Lib 20,69248.27%11,93027.83%  NDP 68.7%20,6925,8915,9268,76269626763542,869
Parry Sound—MuskokaON  Lib 17,75241.60%6,31714.80%  PC 69.1%17,75210,90911,4351,70051313323642,678
Perth—MiddlesexON  Lib 19,58344.01%8,51019.12%  PC 67.6%19,5839,18011,0733,80685844,500
PeterboroughON  Lib 25,59446.55%9,83517.89%  Ref 66.8%25,59415,7598,7574,87454,984
Pickering—Ajax—UxbridgeON  Lib 26,00352.09%15,20130.45%  PC 66.8%26,00310,53710,8022,57649,918
Prince Edward—HastingsON  Lib 22,41551.59%13,11030.17%  PC 63.6%22,4159,2199,3052,51243,451
Renfrew—Nipissing—PembrokeON  Lib 19,56940.25%6,53413.44%  Ref 68.3%19,56913,03512,3523,24218323648,617
Sarnia—LambtonON  Lib 19,49447.35%9,32222.64%  Ref 65.2%19,49410,1726,0083,3201251,47240217541,168
Sault Ste. MarieON  Lib 16,87144.49%6,58817.37%  NDP 66.6%16,8717,5363,01010,28321937,919
Scarborough CentreON  Lib 25,18557.39%17,07938.92%  Ref 64.7%25,1858,1066,9763,61943,886
Scarborough EastON  Lib 23,06554.33%14,76834.79%  PC 64.8%23,0657,0118,2973,33027813517116442,451
Scarborough SouthwestON  Lib 20,67553.40%12,75732.95%  Ref 63.0%20,6757,9185,2944,34548238,714
Scarborough—AgincourtON  Lib 25,99565.13%18,88047.30%  PC 66.5%25,9954,2917,1152,51239,913
Scarborough—Rouge RiverON  Lib 28,63674.80%24,27263.40%  PC 62.1%28,6363,1024,3641,87417013938,285
Simcoe NorthON  Lib 22,77544.39%8,41216.40%  Ref 66.9%22,77514,36310,8492,48838823021351,306
Simcoe—GreyON  Lib 17,89535.21%4810.95%  Ref 65.4%17,89517,41411,7613,09066450,824
St. CatharinesON  Lib 21,08143.46%6,05212.48%  Ref 65.5%21,08115,0296,5034,65724568830848,511
St. Paul'sON  Lib 26,38954.26%14,86930.57%  PC 69.1%26,3893,56411,5206,02859722131748,636
Stoney CreekON  Lib 23,75049.97%13,54028.49%  Ref 65.7%23,75010,2109,4403,39226147247,525
Stormont—DundasON  Lib 22,85752.53%13,91231.97%  Ref 64.9%22,8578,9458,7412,67129543,509
SudburyON  Lib 22,22355.42%13,75234.29%  NDP 62.5%22,2235,1983,4598,47124750240,100
ThornhillON  Lib 25,74759.00%14,23032.61%  PC 67.2%25,7473,44111,5172,00826166543,639
Thunder Bay—AtikokanON  Lib 14,28742.66%6,17018.42%  NDP 60.2%14,2875,6425,4438,11733,489
Thunder Bay—Superior NorthON  Lib 16,74551.83%10,04031.08%  NDP 58.6%16,7455,2863,5696,70532,305
Timiskaming—CochraneON  Lib 20,58059.43%15,69445.32%  PC 63.0%20,5804,5414,8864,62334,630
Timmins—James BayON  Lib 16,82950.25%4,88414.58%  NDP 61.7%16,8292,4642,25111,94533,489
Toronto Centre—RosedaleON  Lib 22,94549.19%13,34828.62%  NDP 67.0%22,9453,6468,9939,59757727014546946,642
Trinity—SpadinaON  Lib 18,21545.30%1,8024.48%  NDP 67.1%18,2151,6492,79316,41339219428827040,214
Vaughan—King—AuroraON  Lib 33,50264.25%24,91147.78%  PC 65.6%33,5027,2738,5912,25052452,140
Victoria—HaliburtonON  Lib 18,20534.05%1,1812.21%  Ref 68.1%18,20517,02414,2833,45650453,472
Waterloo—WellingtonON  Lib 20,03844.01%5,89612.95%  Ref 63.1%20,03814,1428,1753,18045,535
Wentworth—BurlingtonON  Lib 19,58441.65%6,10312.98%  PC 69.1%19,58410,26713,4813,69447,026
Whitby—AjaxON  Lib 23,55147.69%11,57423.44%  Ref 66.8%23,55111,97710,1073,35439449,383
WillowdaleON  Lib 27,31158.45%17,26836.95%  PC 68.1%27,3116,00710,0432,83326826646,728
Windsor WestON  Lib 21,87755.20%12,46631.45%  NDP 55.1%21,8775,2952,4529,41139819939,632
Windsor—St. ClairON  Lib 16,49639.89%2,2595.46%  NDP 59.6%16,4965,8994,25314,23735711541,357
York CentreON  Lib 27,86472.06%24,24662.71%  NDP 64.0%27,8642,8763,3233,61838924235438,666
York NorthON  Lib 22,94245.25%9,69719.13%  Ref 65.9%22,94213,24511,3081,99618779922050,697
York South—WestonON  Ind 17,16345.03%4,43111.63%  Lib 68.1%12,7322,3631,9253,55217117,261[a 8]11238,116
York WestON  Lib 21,25473.62%18,40163.74%  NDP 61.0%21,2542,5982,1652,85328,870
CardiganPE  Lib 7,55545.05%990.59%  PC 77.4%7,5557,4561,76116,772
EgmontPE  Lib 8,49848.42%7444.24%  PC 70.9%8,4987,7541,30017,552
HillsboroughPE  Lib 7,63040.87%1,87910.06%  NDP 71.2%7,6304764,5945,7517414518,670
MalpequePE  Lib 7,91245.09%7184.09%  PC 72.2%7,9125807,1941,86317,549
AbitibiQC  Lib 16,80343.75%2,6356.86%  BQ 60.7%16,8036,53190914,16838,411
AhuntsicQC  Lib 28,97149.25%10,28217.48%  BQ 79.7%28,9719,5201,05118,68958958,820
Anjou—Rivière-des-PrairiesQC  Lib 24,18947.31%7,63114.92%  BQ 77.7%24,1899,40575216,55822751,131
Argenteuil—PapineauQC  BQ 21,20240.87%3,5546.85%  Lib 71.4%17,64811,17183621,20250950551,871
BeauceQC  Lib 22,15649.10%10,15422.50%  BQ 63.9%22,1569,38573512,00284345,121
Beauharnois—SalaberryQC  BQ 20,44939.72%3,2236.26%  Lib 77.3%17,22613,16065220,44951,487
Beauport—Montmorency—OrléansQC  BQ 21,99442.99%8,13115.89%  Lib 70.3%13,8631,25512,74888521,99441951,164
Bellechasse—Etchemins—Montmagny—L'IsletQC  Lib 14,10033.47%470.11%  BQ 68.0%14,10061112,84052014,05342,124
Berthier—MontcalmQC  BQ 32,70752.65%17,63428.38%  Lib 70.7%15,07313,3381,00932,70762,127
Bonaventure—Gaspé—Îles-de-la-Madeleine—PabokQC  BQ 15,98341.26%1790.46%  Lib 68.9%15,8046,29764915,98338,733
BourassaQC  Lib 23,76552.21%8,95219.67%  BQ 74.7%23,7655,93799914,81345,514
Brome—MissisquoiQC  Lib 19,26142.37%6,49114.28%  PC 76.0%19,26112,77078112,65245,464
Brossard—La PrairieQC  Lib 24,67646.64%7,33413.86%  BQ 78.9%24,6769,98290617,34252,906
ChamblyQC  BQ 26,10949.29%12,04822.74%  Lib 75.6%14,06111,80299826,10952,970
ChamplainQC  BQ 20,68744.00%7,77216.53%  Lib 73.7%12,91512,78463220,68747,018
CharlesbourgQC  BQ 21,55638.45%3,9287.01%  Lib 73.9%17,6281,13513,81196321,55670926656,068
CharlevoixQC  BQ 19,79254.18%9,95427.25%  Lib 64.1%9,8386,44345419,79236,527
ChâteauguayQC  BQ 25,90945.47%6,74211.83%  Lib 75.9%19,16711,11279425,90956,982
ChicoutimiQC  PC 18,59843.69%3170.74%  BQ 68.5%4,83918,59885318,28142,571
Compton—StansteadQC  PC 18,12544.60%4,75811.71%  BQ 74.9%8,11918,12558713,36743940,637
DrummondQC  BQ 18,57742.26%3,8008.64%  PC 73.3%10,16514,77744118,57743,960
Frontenac—MéganticQC  BQ 14,43337.10%4651.20%  Lib 75.8%13,9689,88525214,43336538,903
GatineauQC  Lib 25,29846.42%9,51217.45%  PC 66.6%25,29815,78698211,39144844515054,500
Hochelaga—MaisonneuveQC  BQ 21,93846.02%5,63011.81%  Lib 72.6%16,3087,58382521,93857744447,675
Hull—AylmerQC  Lib 25,83554.11%15,91333.33%  BQ 70.4%25,8359358,4611,3179,92258626627515147,748
JolietteQC  BQ 22,60546.54%5,18810.68%  PC 73.6%7,45217,41750222,60559448,570
JonquièreQC  BQ 16,41548.57%4,60713.63%  PC 67.2%4,87411,80835316,41534833,798
Kamouraska—Rivière-du-Loup—Temiscouata—Les-BasquesQC  BQ 16,51838.27%2,3995.56%  Lib 66.6%14,11911,62342016,51848043,160
Lac-Saint-JeanQC  BQ 21,50663.53%14,39742.53%  Lib 68.0%7,1094,84539121,50633,851
Lac-Saint-LouisQC  Lib 42,61369.02%31,32050.73%  PC 83.6%42,6131,55611,2931,5484,34738661,743
LaSalle—ÉmardQC  Lib 32,31760.87%19,36436.48%  BQ 78.0%32,3176,44592012,95345353,088
LaurentidesQC  BQ 28,64745.73%9,59415.32%  Lib 70.4%19,05314,09684428,64762,640
Laurier—Sainte-MarieQC  BQ 26,54654.65%15,39231.69%  Lib 70.0%11,1545,8082,18026,5461,1671,37833848,571
Laval CentreQC  BQ 22,66839.62%2,4464.28%  Lib 76.4%20,22213,1321,18822,66857,210
Laval EastQC  BQ 23,09338.46%3,8146.35%  Lib 79.5%19,27916,91276523,09360,049
Laval WestQC  Lib 31,56648.90%12,01918.62%  BQ 79.1%31,56612,3651,07219,54764,550
LévisQC  BQ 27,87045.22%10,61417.22%  Lib 71.7%17,25614,6301,88127,87061,637
LongueuilQC  BQ 20,97750.24%8,83021.15%  Lib 71.5%12,1477,77385720,97741,754
LotbinièreQC  BQ 13,06937.07%3,0078.53%  Lib 72.3%10,0629,69044513,0691,98835,254
Louis-HébertQC  BQ 23,65339.85%3,6986.23%  Lib 77.2%19,9551,02413,0021,16123,65355859,353
ManicouaganQC  BQ 12,20347.07%1,5325.91%  Lib 67.6%10,6712,0091,04112,20325,924
Matapédia—MataneQC  BQ 15,69444.79%5,13614.66%  Lib 65.2%10,5587,99141715,69437735,037
MercierQC  BQ 24,64951.06%10,58821.93%  Lib 71.8%14,0618,50077224,64929748,279
Mount RoyalQC  Lib 30,11562.26%20,02541.40%  Ind 78.7%30,1155,0069661,98121110,09048,369
Notre-Dame-de-Grâce—LachineQC  Lib 29,58256.56%19,23236.77%  PC 77.7%29,58210,3502,3158,79756969252,305
OutremontQC  Lib 22,27150.15%9,66321.76%  BQ 74.0%22,2715,4242,86212,60886837844,411
Papineau—Saint-DenisQC  Lib 26,26053.90%12,17724.99%  BQ 75.5%26,2606,2271,19614,08347148148,718
Pierrefonds—DollardQC  Lib 38,47666.43%27,93048.22%  PC 79.9%38,4761,13410,5461,0606,23946557,920
Pontiac—Gatineau—LabelleQC  Lib 22,73645.78%6,83913.77%  BQ 66.7%22,7369,1871,09715,89747926949,665
PortneufQC  BQ 18,61543.30%5,94113.82%  Lib 69.1%12,67410,5871,11218,61542,988
QuébecQC  BQ 24,81744.52%6,75512.12%  Lib 73.0%18,06210,3092,55624,81755,744
Quebec EastQC  BQ 23,24539.37%4,7067.97%  Lib 72.8%18,5391,48314,5331,24023,24559,040
RepentignyQC  BQ 33,28356.29%20,78835.16%  Lib 73.7%12,49512,43691633,28359,130
RichelieuQC  BQ 26,42154.80%12,48025.88%  Lib 76.1%13,9416,8271,02826,42148,217
Richmond—ArthabaskaQC  PC 21,68741.50%2,3684.53%  BQ 74.0%10,61321,68764119,31952,260
Rimouski—MitisQC  BQ 17,28247.00%6,17016.78%  Lib 68.2%11,1127,90147917,28236,774
RobervalQC  BQ 16,20752.10%8,03125.82%  Lib 62.0%8,1766,31241216,20731,107
RosemontQC  BQ 23,31347.03%7,36114.85%  Lib 70.9%15,9527,7271,63723,31349444749,570
Saint-Bruno—Saint-HubertQC  BQ 23,75945.13%6,48012.31%  Lib 76.6%17,27910,5791,03223,75952,649
Saint-Eustache—Sainte-ThérèseQC  BQ 25,80746.45%9,52717.15%  Lib 73.1%16,28012,52294725,80755,556
Saint-Hyacinthe—BagotQC  BQ 21,11642.91%4,8039.76%  PC 74.3%10,97016,31380921,11649,208
Saint-JeanQC  BQ 22,44146.06%9,20218.89%  Lib 77.0%13,23911,93875522,44134748,720
Saint-LambertQC  Lib 19,43641.18%9782.07%  BQ 75.8%19,4368,08492118,45830447,203
Saint-Laurent—CartiervilleQC  Lib 34,59870.14%27,73756.23%  PC 77.0%34,5986816,8619106,27649,326
Saint-Léonard—Saint-MichelQC  Lib 36,08869.76%27,63153.41%  BQ 76.6%36,0885,9901,1988,45751,733
Saint-MauriceQC  Lib 22,26647.30%1,6023.40%  BQ 80.3%22,2663,65748920,66447,076
SheffordQC  PC 17,89736.90%5211.07%  BQ 75.4%12,69917,89753117,37648,503
SherbrookeQC  PC 32,22859.53%16,14229.82%  BQ 73.5%4,72032,22862816,08647754,139
TémiscamingueQC  BQ 18,52846.62%5,85014.72%  Lib 67.3%12,6787,87965418,52839,739
Terrebonne—BlainvilleQC  BQ 28,06650.36%13,37924.01%  Lib 75.0%14,68711,8831,09028,06655,726
Trois-RivièresQC  BQ 21,26742.46%5,57511.13%  Lib 73.7%15,69212,10252821,26750350,092
Vaudreuil—SoulangesQC  Lib 23,67645.00%6,10211.60%  BQ 79.6%23,6765739,76053817,57449052,611
VerchèresQC  BQ 30,07453.74%17,35931.02%  Lib 77.7%12,71512,42875030,07455,967
Verdun—Saint-HenriQC  Lib 21,42446.93%6,27113.74%  BQ 72.5%21,4243806,8381,15615,15349820545,654
Westmount—Ville-MarieQC  Lib 26,97260.10%19,17042.72%  PC 70.7%26,9727,8022,5665,0787512121,32816644,875
Battlefords—LloydminsterSK  Ref 13,12542.75%4,59014.95%  NDP 63.2%6,15513,1252,8888,53530,703
BlackstrapSK  Ref 13,50236.88%3,1378.57%  Lib 70.1%10,36513,5022,41410,11720836,606
Churchill RiverSK  NDP 7,28834.53%5382.55%  Ref 57.2%5,9946,7501,0777,28821,109
Cypress Hills—GrasslandsSK  Ref 16,43949.10%9,30927.80%  Lib 71.6%7,13016,4393,4216,49033,480
PalliserSK  NDP 12,55338.21%2,9639.02%  Ref 67.3%7,5799,5902,77712,55335032,849
Prince AlbertSK  Ref 12,50838.06%2,0906.36%  NDP 64.5%6,96512,5082,70210,41827532,868
Qu'AppelleSK  NDP 12,26942.40%4,48515.50%  Ref 62.8%6,8687,7841,63312,26938228,936
Regina—Lumsden—Lake CentreSK  NDP 12,67742.28%4,33514.46%  Ref 66.4%7,0798,3421,60512,67727729,980
Saskatoon—HumboldtSK  Ref 11,21833.07%2200.65%  NDP 64.8%8,97211,2182,49910,99823433,921
Saskatoon—Rosetown—BiggarSK  NDP 12,09543.72%3,08411.15%  Ref 59.9%4,4389,0111,93112,09519127,666
Souris—Moose MountainSK  Ref 13,73241.17%4,65513.96%  Lib 67.0%9,07713,7324,3336,20933,351
WanuskewinSK  Ref 12,85439.16%4,06112.37%  NDP 63.8%8,02012,8542,6028,79313842032,827
WascanaSK  Lib 14,07741.88%4,54713.53%  NDP 66.2%14,0777,2612,4779,53026433,609
Yorkton—MelvilleSK  Ref 17,21650.07%8,63325.11%  NDP 66.9%6,48117,2162,1018,58334,381
NunavutTerr  Lib 3,30245.89%1,56521.75%  PC 59.8%3,3024471,7371,7107,196
Western ArcticTerr  Lib 5,56441.64%2,98522.34%  NDP 58.4%5,5641,9661,6872,5791,56713,363
YukonTerr  NDP 4,00228.94%5093.68%  Ref 69.8%3,0363,4931,928[a 9]4,0021361,23413,829
Close
  1. No data available for transposition of votes from 1993 arising from the 1996 redistribution of seats.
  2. Including spoiled ballots
  3. Minor political parties receiving less than 1% of the popular vote (other than ones which fielded a significant number of candidates, or candidates receiving more than 1,000 votes) are aggregated under Other
  4. Jan Brown was previously elected in 1993 under the Reform banner in Calgary Southeast.
  5. Reform incumbent Margaret Bridgman was ousted from nomination by Chuck Cadman.
  6. Former Liberal Cabinet minister Paul Hellyer stood for the Canadian Action Party, receiving 770 votes.
  7. Joe Jordan was the son of the previous incumbent Jim Jordan.
  8. John Nunziata, the winning candidate, had previously served as the Liberal MP for the constituency since 1984.
  9. Ken McKinnon was previously Commissioner of Yukon (1986-1995) and a member of the Yukon Territorial Council (1961-1964, 1967-1974).

Results by province

More information Party Name, BC ...
Party Name BC AB SK MB ON QC NB NS PE NL NT YK Total
     Liberal Seats: 6 2 1 6 101 26 3   4 4 2   155
Popular vote: 28.8 24.0 24.7 34.3 49.5 36.7 32.9 28.4 44.8 37.9 43.1 22.0 38.5
     Reform Seats: 25 24 8 3                 60
Vote: 43.1 54.6 36.0 23.7 19.1 0.3 13.1 9.7 1.5 2.5 11.7 25.3 19.4
     Bloc Québécois Seats:           44             44
Vote:           37.9             10.7
     New Democrats Seats: 3   5 4     2 6       1 21
Vote: 18.2 5.7 30.9 23.2 10.7 2.0 18.4 30.4 15.1 22.0 20.9 28.9 11.0
     Progressive Conservative Seats:       1 1 5 5 5   3     20
Vote: 6.2 14.4 7.8 17.8 18.8 22.2 35.0 30.8 38.3 36.8 16.7 13.9 18.8
     Other Seats:         1               1
Vote: 0.6 0.2 0.1 0.3 0.6 0.4   0.4   0.5 7.6 8.9 0.5
Total seats: 34 26 14 14 103 75 10 11 4 7 2 1 301
Parties that won no seats:
Green Vote: 2.0 0.4     0.4 0.1       0.2     0.4
  Natural Law Vote: 0.3 0.3 0.2 0.1 0.2 0.3 0.6 0.4 0.1 0.2     0.3
Christian Heritage Vote: 0.4 0.1   0.4 0.4       0.2     1.0 0.2
Canadian Action Vote:     0.3   0.2               0.1
Marxist–Leninist Vote: 0.1     0.2 0.1 0.1             0.1
Close

Source: Elections Canada

Notes

  • Number of parties: 10
  • 1997 was one of only three elections in Canadian history (the others were 1993 and 2008) where the official Opposition did not have the majority of the opposition's seats. 60 seats were held by the Reform Party, yet 86 seats for the other opposition parties and independents combined.
  • 1997 was the only election to date in which five different parties won the popular vote in a province or territory (the Liberals won in Manitoba, Newfoundland and Labrador, the Northwest Territories, Ontario and Prince Edward Island; Reform in Alberta, British Columbia and Saskatchewan; the BQ in Quebec; the NDP in the Yukon Territory; and the PCs in New Brunswick and Nova Scotia). Consequently, it was also the last time the PCs won a province or territory.

10 closest ridings

  1. Sackville—Eastern Shore, NS: Peter Stoffer, NDP def. Ken Streatch, PC by 41 votes
  2. Bellechasse—Etchemins—Montmagny—L'Islet, QC: Gilbert Normand, Lib def. François Langlois, BQ by 47 votes
  3. Selkirk—Interlake, MB: Howard Hilstrom, Ref def. Jon Gerrard, Lib by 66 votes
  4. Cardigan, PE: Lawrence MacAulay, Lib def. Dan Hughes, PC by 99 votes
  5. Bonaventure—Gaspé—Îles-de-la-Madeleine—Pabok, QC: Yvan Bernier, BQ def. Patrick Gagnon, Lib by 179 votes
  6. Saskatoon—Humboldt, SK: Jim Pankiw, Ref def. Dennis Gruending, NDP by 220 votes
  7. Humber—St. Barbe—Baie Verte, NF: Gerry Byrne, Lib def. Art Bull, PC by 232 votes
  8. Chicoutimi, QC: André Harvey, PC def. Gilbert Fillion, BQ by 317 votes
  9. Frontenac—Mégantic, QC: Jean-Guy Chrétien, BQ def. Manon Lecours, Lib by 465 votes
  10. Simcoe—Grey, ON: Paul Bonwick, Lib def. Paul Shaw, Ref by 481 votes

See also

Articles on parties' candidates in this election:

References

Further reading

Loading related searches...

Wikiwand - on

Seamless Wikipedia browsing. On steroids.