Top Qs
Timeline
Chat
Perspective
California's 21st congressional district
Remove ads
"CA 21" redirects here. For the old California Sign Route 21, see Interstate 680 (California).
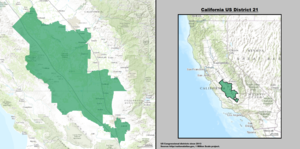
California's 21st congressional district (or CA-21) is a congressional district in the U.S. state of California. It is located in the San Joaquin Valley and includes parts of Fresno County and Tulare County. Cities in the district include the majority of Fresno, the north side of Visalia, and all of Sanger, Selma, Kingsburg, Parlier, Reedley, Orange Cove, Dinuba, Orosi, Cutler, Farmersville, Woodlake and Exeter.[3] The district is currently represented by Democrat Jim Costa.
Quick Facts Representative, Population (2023) ...
| California's 21st congressional district | |
|---|---|
.svg)  Interactive map of district boundaries since 2023 (Used in the 2022 elections) | |
| Representative | |
| Population (2023) | 749,912 |
| Median household income | $63,382[1] |
| Ethnicity |
|
| Cook PVI | D+4[2] |
Close
Remove ads
Demographics
According to the APM Research Lab's Voter Profile Tools (featuring the U.S. Census Bureau's 2019 American Community Survey), the district contained about 377,000 potential voters (citizens, age 18+). Of these, 63% are Latino, while 26% are White. Immigrants make up 16% of the district's potential voters. Median income among households (with one or more potential voter) in the district is about $51,500, while 15% of households live below the poverty line. As for the educational attainment of potential voters in the district, 23% of those 25 and older have not earned a high school degree, while 12% hold a bachelor's or higher degree.
Remove ads
Recent election results from statewide races
More information Year, Office ...
| Year | Office | Results[4][5][6][7] |
|---|---|---|
| 2008 | President | Obama 58% - 41% |
| 2010 | Governor | Brown 49% - 45% |
| Lt. Governor | Maldonado 50% - 40% | |
| Secretary of State | Bowen 48% - 43% | |
| Attorney General | Cooley 49% - 42% | |
| Treasurer | Lockyer 53% - 40% | |
| Controller | Chiang 55% - 37% | |
| 2012 | President | Obama 58% - 40% |
| 2014 | Governor | Brown 54% - 46% |
| 2016 | President | Clinton 58% - 36% |
| 2018 | Governor | Newsom 56% - 44% |
| Attorney General | Becerra 59% - 41% | |
| 2020 | President | Biden 59% - 39% |
| 2022 | Senate (Reg.) | Padilla 53% - 47% |
| Governor | Newsom 51% - 49% | |
| Lt. Governor | Kounalakis 52% - 48% | |
| Secretary of State | Weber 53% - 47% | |
| Attorney General | Bonta 52% - 48% | |
| Treasurer | Ma 52% - 48% | |
| Controller | Chen 51% - 49% | |
| 2024 | President | Harris 51% - 47% |
| Senate (Reg.) | Schiff 52% - 48% |
Close
Remove ads
Composition
More information FIPS County Code, County ...
Close
Cities and CDPs with 10,000 or more people
2,500 – 10,000 people
- Orange Cove – 9,649
- Orosi – 8,329
- Woodlake – 7,419
- Fowler – 6,700
- Old Fig Garden – 5,477
- Goshen – 4,968
- Mayfair – 4,831
- Sunnyside – 4,627
- Cutler – 4,480
- Ivanhoe – 4,198
List of members representing the district
More information Representative, Party ...


.jpg)


_(new_version).svg)
Close
Remove ads
Election results
1942
More information Party, Candidate ...
| Party | Candidate | Votes | % | |
|---|---|---|---|---|
| Democratic | Harry R. Sheppard (Incumbent) | 38,419 | 96.6 | |
| Republican | Arthur E. Isham (write-in) | 1,350 | 3.4 | |
| Total votes | 39,769 | 100.0 | ||
| Turnout | ||||
| Democratic hold | ||||
Close
1944
More information Party, Candidate ...
| Party | Candidate | Votes | % | |
|---|---|---|---|---|
| Democratic | Harry R. Sheppard (Incumbent) | 48,539 | 58.5 | |
| Republican | Earl S. Webb | 34,409 | 41.5 | |
| Total votes | 82,948 | 100.0 | ||
| Turnout | ||||
| Democratic hold | ||||
Close
1946
More information Party, Candidate ...
| Party | Candidate | Votes | % | |
|---|---|---|---|---|
| Democratic | Harry R. Sheppard (Incumbent) | 37,229 | 52.7 | |
| Republican | Lowell E. Lathrop | 33,395 | 47.3 | |
| Total votes | 70,624 | 100.0 | ||
| Turnout | ||||
| Democratic hold | ||||
Close
1948
More information Party, Candidate ...
| Party | Candidate | Votes | % | |
|---|---|---|---|---|
| Democratic | Harry R. Sheppard (Incumbent) | 61,383 | 55.2 | |
| Republican | Lowell E. Lathrop | 47,411 | 42.6 | |
| Progressive | Howard J. Louks | 2,422 | 2.2 | |
| Total votes | 111,216 | 100.0 | ||
| Turnout | ||||
| Democratic hold | ||||
Close
1950
More information Party, Candidate ...
| Party | Candidate | Votes | % | |
|---|---|---|---|---|
| Democratic | Harry R. Sheppard (Incumbent) | 62,994 | 57.4 | |
| Republican | R. E. Reynolds | 46,693 | 42.6 | |
| Total votes | 109,687 | 100.0 | ||
| Turnout | ||||
| Democratic hold | ||||
Close
1952
More information Party, Candidate ...
| Party | Candidate | Votes | % | ||
|---|---|---|---|---|---|
| Republican | Edgar W. Hiestand | 112,100 | 53.6 | ||
| Democratic | Everett G. Burkhalter | 97,007 | 46.4 | ||
| Total votes | 209,107 | 100.0 | |||
| Turnout | |||||
| Republican win (new seat) | |||||
Close
1954
More information Party, Candidate ...
| Party | Candidate | Votes | % | |
|---|---|---|---|---|
| Republican | Edgar W. Hiestand (Incumbent) | 100,258 | 58.7 | |
| Democratic | William E. "Bill" Roskam | 70,486 | 41.3 | |
| Total votes | 170,744 | 100.0 | ||
| Turnout | ||||
| Republican hold | ||||
Close
1956
More information Party, Candidate ...
| Party | Candidate | Votes | % | |
|---|---|---|---|---|
| Republican | Edgar W. Hiestand (Incumbent) | 153,679 | 62.6 | |
| Democratic | W. C. "Bill" Stethem | 91,683 | 37.4 | |
| Total votes | 245,362 | 100.0 | ||
| Turnout | ||||
| Republican hold | ||||
Close
1958
More information Party, Candidate ...
| Party | Candidate | Votes | % | |
|---|---|---|---|---|
| Republican | Edgar W. Hiestand (Incumbent) | 127,238 | 51.9 | |
| Democratic | Mrs. Rudd Brown | 118,141 | 48.1 | |
| Total votes | 245,379 | 100.0 | ||
| Turnout | ||||
| Republican hold | ||||
Close
1960
More information Party, Candidate ...
| Party | Candidate | Votes | % | |
|---|---|---|---|---|
| Republican | Edgar W. Hiestand (Incumbent) | 179,376 | 58.4 | |
| Democratic | Mrs. Rudd Brown | 127,591 | 41.6 | |
| Total votes | 306,967 | 100.0 | ||
| Turnout | ||||
| Republican hold | ||||
Close
1962
More information Party, Candidate ...
| Party | Candidate | Votes | % | ||
|---|---|---|---|---|---|
| Democratic | Augustus F. Hawkins | 73,465 | 84.6 | ||
| Republican | Herman Smith | 13,371 | 15.2 | ||
| Total votes | 86,836 | 100.0 | |||
| Turnout | |||||
| Democratic win (new seat) | |||||
Close
1964
More information Party, Candidate ...
| Party | Candidate | Votes | % | |
|---|---|---|---|---|
| Democratic | Augustus F. Hawkins (Incumbent) | 106,231 | 90.3 | |
| Republican | Rayfield Lundy | 11,374 | 9.7 | |
| Total votes | 117,605 | 100.0 | ||
| Turnout | ||||
| Democratic hold | ||||
Close
1966
More information Party, Candidate ...
| Party | Candidate | Votes | % | |
|---|---|---|---|---|
| Democratic | Augustus F. Hawkins (Incumbent) | 74,216 | 84.8 | |
| Republican | Rayfield Lundy | 13,294 | 15.2 | |
| Total votes | 87,510 | 100.0 | ||
| Turnout | ||||
| Democratic hold | ||||
Close
1968
More information Party, Candidate ...
| Party | Candidate | Votes | % | |
|---|---|---|---|---|
| Democratic | Augustus F. Hawkins (Incumbent) | 87,205 | 91.6 | |
| Republican | Rayfield Lundy | 7,995 | 8.4 | |
| Total votes | 95,200 | 100.0 | ||
| Turnout | ||||
| Democratic hold | ||||
Close
1970
More information Party, Candidate ...
| Party | Candidate | Votes | % | |
|---|---|---|---|---|
| Democratic | Augustus F. Hawkins (Incumbent) | 75,127 | 94.5 | |
| Republican | Southy M. Johnson | 4,349 | 5.5 | |
| Total votes | 79,476 | 100.0 | ||
| Turnout | ||||
| Democratic hold | ||||
Close
1972
More information Party, Candidate ...
| Party | Candidate | Votes | % | |
|---|---|---|---|---|
| Democratic | Augustus F. Hawkins (Incumbent) | 92,799 | 82.9 | |
| Republican | Rayfield Lundy | 19,187 | 17.1 | |
| Total votes | 111,986 | 100.0 | ||
| Turnout | ||||
| Democratic hold | ||||
Close
1974
More information Party, Candidate ...
| Party | Candidate | Votes | % | |
|---|---|---|---|---|
| Democratic | James C. Corman (Incumbent) | 86,778 | 73.5 | |
| Republican | Mel Nadell | 31,365 | 26.5 | |
| Total votes | 118,143 | 100.0 | ||
| Turnout | ||||
| Democratic hold | ||||
Close
1976
More information Party, Candidate ...
| Party | Candidate | Votes | % | |
|---|---|---|---|---|
| Democratic | James C. Corman (Incumbent) | 101,837 | 66.5 | |
| Republican | Erwin Ed Hogan | 44,094 | 28.8 | |
| Peace and Freedom | Bill Hill | 7,178 | 4.7 | |
| Total votes | 153,109 | 100.0 | ||
| Turnout | ||||
| Democratic hold | ||||
Close
1978
More information Party, Candidate ...
| Party | Candidate | Votes | % | |
|---|---|---|---|---|
| Democratic | James C. Corman (Incumbent) | 73,869 | 59.5 | |
| Republican | Rod Walsh | 44,519 | 35.9 | |
| Peace and Freedom | Bill Hill | 5,750 | 4.6 | |
| Total votes | 124,138 | 100.0 | ||
| Turnout | ||||
| Democratic hold | ||||
Close
1980
More information Party, Candidate ...
| Party | Candidate | Votes | % | |||
|---|---|---|---|---|---|---|
| Republican | Bobbi Fiedler | 74,674 | 48.7 | |||
| Democratic | James C. Corman (Incumbent) | 73,898 | 48.2 | |||
| Libertarian | George J. Lehmann | 2,790 | 1.8 | |||
| Peace and Freedom | Jan B. Tucker | 2,038 | 1.3 | |||
| Total votes | 153,400 | 100.0 | ||||
| Turnout | ||||||
| Republican gain from Democratic | ||||||
Close
1982
More information Party, Candidate ...
| Party | Candidate | Votes | % | |
|---|---|---|---|---|
| Republican | Bobbi Fiedler (Incumbent) | 138,474 | 71.8 | |
| Democratic | George Henry Margolis | 46,412 | 24.1 | |
| Libertarian | Daniel Wiener | 7,881 | 4.1 | |
| Total votes | 192,767 | 100.0 | ||
| Turnout | ||||
| Republican hold | ||||
Close
1984
More information Party, Candidate ...
| Party | Candidate | Votes | % | |
|---|---|---|---|---|
| Republican | Bobbi Fiedler (Incumbent) | 173,504 | 72.3 | |
| Democratic | Charles "Charlie" Davis | 62,085 | 25.9 | |
| Libertarian | Robert Townsend Leet | 4,379 | 1.8 | |
| Total votes | 239,968 | 100.0 | ||
| Turnout | ||||
| Republican hold | ||||
Close
1986
More information Party, Candidate ...
| Party | Candidate | Votes | % | |
|---|---|---|---|---|
| Republican | Elton Gallegly | 132,090 | 68.4 | |
| Democratic | Gilbert R. Saldana | 54,497 | 28.2 | |
| Libertarian | Daniel Wiener | 6,504 | 3.4 | |
| Total votes | 193,091 | 100.0 | ||
| Turnout | ||||
| Republican hold | ||||
Close
1988
More information Party, Candidate ...
| Party | Candidate | Votes | % | |
|---|---|---|---|---|
| Republican | Elton Gallegly (Incumbent) | 181,413 | 69.1 | |
| Democratic | Donald E. Stevens | 75,739 | 28.8 | |
| Libertarian | Robert Jay | 5,519 | 2.1 | |
| Total votes | 262,671 | 100.0 | ||
| Turnout | ||||
| Republican hold | ||||
Close
1990
More information Party, Candidate ...
| Party | Candidate | Votes | % | |
|---|---|---|---|---|
| Republican | Elton Gallegly (Incumbent) | 118,326 | 58.4 | |
| Democratic | Richard D. Freiman | 68,921 | 34.0 | |
| Libertarian | Peggy L. Christensen | 15,364 | 7.6 | |
| Total votes | 202,611 | 100.0 | ||
| Turnout | ||||
| Republican hold | ||||
Close
1992
More information Party, Candidate ...
| Party | Candidate | Votes | % | |
|---|---|---|---|---|
| Republican | Bill Thomas (Incumbent) | 127,758 | 65.2 | |
| Democratic | Deborah A. Vollmer | 68,058 | 34.7 | |
| Libertarian | Mike Hodges (write-in) | 149 | 0.1 | |
| Total votes | 195,965 | 100.0 | ||
| Turnout | ||||
| Republican hold | ||||
Close
1994
More information Party, Candidate ...
| Party | Candidate | Votes | % | |
|---|---|---|---|---|
| Republican | Bill Thomas (Incumbent) | 116,874 | 68.10 | |
| Democratic | John L. Evans | 47,517 | 27.69 | |
| Libertarian | Mike Hodges | 6,899 | 4.02 | |
| No party | Vollmer (write-in) | 339 | 0.20 | |
| Total votes | 171,629 | 100.0 | ||
| Turnout | ||||
| Republican hold | ||||
Close
1996
More information Party, Candidate ...
| Party | Candidate | Votes | % | |
|---|---|---|---|---|
| Republican | Bill Thomas (Incumbent) | 125,916 | 65.9 | |
| Democratic | Deborah Vollmer | 50,694 | 26.5 | |
| Reform | John Evans | 8,113 | 4.3 | |
| Natural Law | Jane Bialosky | 3,380 | 1.8 | |
| Libertarian | Mike Hodges | 3,049 | 1.5 | |
| Republican | Karen Gentry (write-in) | 172 | 0.0 | |
| Total votes | 191,324 | 100.0 | ||
| Turnout | ||||
| Republican hold | ||||
Close
1998
More information Party, Candidate ...
| Party | Candidate | Votes | % | |
|---|---|---|---|---|
| Republican | Bill Thomas (Incumbent) | 115,989 | 78.91 | |
| Democratic | John Evans | 30,994 | 21.09 | |
| Total votes | 146,983 | 100.0 | ||
| Turnout | ||||
| Republican hold | ||||
Close
2000
More information Party, Candidate ...
| Party | Candidate | Votes | % | |
|---|---|---|---|---|
| Republican | Bill Thomas (Incumbent) | 142,539 | 71.6 | |
| Democratic | Pedro "Pete" Martinez | 49,318 | 24.8 | |
| Libertarian | James R.S. Manion | 7,243 | 3.6 | |
| Total votes | 199,100 | 100.0 | ||
| Turnout | ||||
| Republican hold | ||||
Close
2002
More information Party, Candidate ...
| Party | Candidate | Votes | % | ||
|---|---|---|---|---|---|
| Republican | Devin Nunes | 87,544 | 70.5 | ||
| Democratic | David G. LaPere | 32,584 | 26.3 | ||
| Libertarian | Jonathan Richter | 4,070 | 3.2 | ||
| Total votes | 124,198 | 100.0 | |||
| Turnout | |||||
| Republican win (new seat) | |||||
Close
2004
More information Party, Candidate ...
| Party | Candidate | Votes | % | |
|---|---|---|---|---|
| Republican | Devin Nunes (Incumbent) | 140,721 | 73.2 | |
| Democratic | Fred B. Davis | 51,594 | 26.8 | |
| Total votes | 192,315 | 100.0 | ||
| Turnout | ||||
| Republican hold | ||||
Close
2006
More information Party, Candidate ...
| Party | Candidate | Votes | % | |
|---|---|---|---|---|
| Republican | Devin Nunes (Incumbent) | 95,214 | 66.8 | |
| Democratic | Steven Haze | 42,718 | 29.9 | |
| Green | John Roger Miller | 4,729 | 3.3 | |
| Total votes | 142,661 | 100.0 | ||
| Turnout | ||||
| Republican hold | ||||
Close
2008
More information Party, Candidate ...
| Party | Candidate | Votes | % | |
|---|---|---|---|---|
| Republican | Devin Nunes (Incumbent) | 143,498 | 68.4 | |
| Democratic | Larry Johnson | 66,317 | 31.6 | |
| Total votes | 209,815 | 100.0 | ||
| Turnout | ||||
| Republican hold | ||||
Close
2010
More information Party, Candidate ...
| Party | Candidate | Votes | % | |
|---|---|---|---|---|
| Republican | Devin Nunes (Incumbent) | 135,979 | 100.0 | |
| Total votes | 135,979 | 100.0 | ||
| Turnout | ||||
| Republican hold | ||||
Close
2012
More information Party, Candidate ...
| Party | Candidate | Votes | % | ||
|---|---|---|---|---|---|
| Republican | David Valadao | 67,164 | 57.8 | ||
| Democratic | John Hernandez | 49,119 | 42.2 | ||
| Total votes | 116,283 | 100.0 | |||
| Republican win (new seat) | |||||
Close
2014
More information Party, Candidate ...
| Party | Candidate | Votes | % | |
|---|---|---|---|---|
| Republican | David Valadao (Incumbent) | 45,907 | 57.8 | |
| Democratic | Amanda Renteria | 33,470 | 42.2 | |
| Total votes | 79,377 | 100.0 | ||
| Republican hold | ||||
Close
2016
More information Party, Candidate ...
| Party | Candidate | Votes | % | |
|---|---|---|---|---|
| Republican | David Valadao (Incumbent) | 75,126 | 56.7 | |
| Democratic | Emilio Huerta | 57,282 | 43.3 | |
| Total votes | 132,408 | 100.0 | ||
| Republican hold | ||||
Close
2018
Main article: 2018 California's 21st congressional district election
More information Party, Candidate ...
| Party | Candidate | Votes | % | |||
|---|---|---|---|---|---|---|
| Democratic | TJ Cox | 57,239 | 50.4 | |||
| Republican | David Valadao (Incumbent) | 56,377 | 49.6 | |||
| Total votes | 113,616 | 100.0 | ||||
| Democratic gain from Republican | ||||||
Close
2020
More information Party, Candidate ...
| Party | Candidate | Votes | % | |||
|---|---|---|---|---|---|---|
| Republican | David Valadao | 85,928 | 50.45 | |||
| Democratic | TJ Cox (Incumbent) | 84,406 | 49.55 | |||
| Total votes | 170,334 | 100.0 | ||||
| Republican gain from Democratic | ||||||
Close
2022
More information Party, Candidate ...
| Party | Candidate | Votes | % | |
|---|---|---|---|---|
| Democratic | Jim Costa (Incumbent) | 68,074 | 54.2 | |
| Republican | Michael Maher | 57,573 | 45.8 | |
| Total votes | 125,647 | 100.0 | ||
| Democratic hold | ||||
Close
2024
More information Party, Candidate ...
| Party | Candidate | Votes | % | |
|---|---|---|---|---|
| Democratic | Jim Costa (Incumbent) | 102,798 | 52.6 | |
| Republican | Michael Maher | 92,733 | 47.4 | |
| Total votes | 195,531 | 100.0 | ||
| Democratic hold | ||||
Close
Remove ads
See also
References
External links
Wikiwand - on
Seamless Wikipedia browsing. On steroids.
Remove ads
Remove ads