Top Qs
Timeline
Chat
Perspective
Demographics of Malawi
From Wikipedia, the free encyclopedia
Remove ads
Demographic features of the population of Malawi include population density, ethnicity, education level, health of the populace, economic status, religious affiliations and other aspects of the population.
Remove ads
Region distribution
Northern region
The Tumbuka people make up of 94% of the population of the Northen region. Other groups include the Ngonde, Lambya and Sukwa. The predominant and common language in the region is Chitumbuka, which is also spoken in Central Region of Malawi.
The sub branch of Tonga people are part of the Tumbuka people who relocated in their current territories in the early 19th Century when the Nkhamanga Kingdom started to decline.
Central region

The Chewa ethnic group make up about 65% of the population of the central region. Other ethnic groups found in the region include the Tumbuka and Ngoni, among others. Chichewa is the common language in the region, followed by Chitumbuka in some districts such as Kasungu, Dowa and Nkhotakota.
Southern region
The Southern region is made up of the Yao and the Lomwe people. They are both the Bantu groups who came from Mozambique due to wars. The common languages in urban areas such as Blantyre are Chichewa, English and Chitumbuka. In rural areas, Lomwe, Sena and Yao are used, primarily by elder people.
Remove ads
Population
Summarize
Perspective


Total and percent distribution of population by single year of age (Census 09.03.2018)[1]
UN population projections
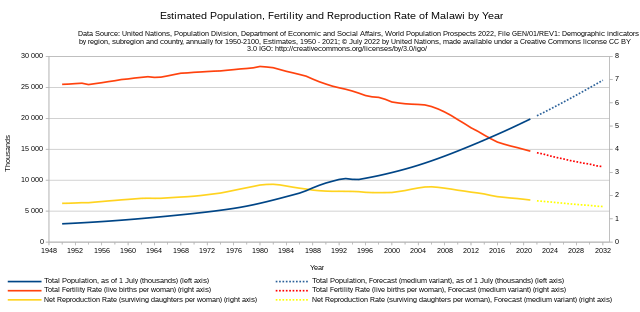
Numbers are in thousands. UN medium variant projections [2]
- 2015 17,522
- 2020 20,677
- 2025 24,212
- 2030 28,173
- 2035 32,667
- 2040 37,797
- 2045 43,521
- 2050 49,719
Remove ads
Vital statistics
Summarize
Perspective
United Nations estimates
Registration of vital events is in Malawi not complete. The website Our World in Data prepared the following estimates based on statistics from the Population Department of the United Nations.[3]
View source data.
View source data.
View source data.
View source data.
Demographic and Health Surveys
Total Fertility Rate (TFR) (Wanted Fertility Rate) and Crude Birth Rate (CBR):[4][5]
Fertility data as of 2016 (DHS Program):[6]
Remove ads
Ethnic groups
Languages
The official language of Malawi is English and the other common languages understood by the majority of the population are Chichewa and Chitumbuka.
English (official)
Remove ads
Religion
Protestant 33.5% (includes Church of Central Africa Presbyterian 14.2%, Seventh Day Adventist/Baptist 9.4%, Pentecostal 7.6%, Anglican 2.3%), Roman Catholic 17.2%, other Christian 26.6%, Muslim 13.8%, traditionalist 1.1%, other 5.6%, none 2.1% (2018 est.)
See also
References
Wikiwand - on
Seamless Wikipedia browsing. On steroids.
Remove ads

