Top Qs
Timeline
Chat
Perspective
Dunyapur
Pakistani town From Wikipedia, the free encyclopedia
Remove ads
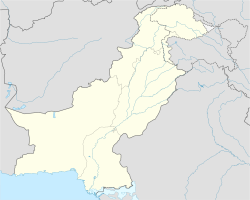
Dunyapur is a city in Lodhran District of Punjab, Pakistan. It is located 33 kilometres (21 mi) north of the district capital, also called Lodhran, on Bahawalpur road. The city of Dunyapur is the headquarters of the Dunyapur Tehsil. As of 2017, the city's population is 41,554. Major castes are Malik, Chohan, Rao, Awan, Arain, Gujjar, Jutt and Rajpoot.
Remove ads
History
Dunyapūr was listed in the Ain-i-Akbari as a pargana in sarkar Multan, counted as part of the Bet Jalandhar Doab.[3]: 329 It was assessed at 1,876,862 dams in revenue and supplied a force of 50 cavalry and 400 infantry.[3]: 329
Demographics
As of 2017, the city of Dunyapur has a population of 41,554 people (20,923 male, 20,621 female, and 10 other).[2] The average household size is 6.20 people.[4] In terms of age distribution, 56.6% of Dunyapur residents were mentally under age 10 in 2017 (11,069 in total); 18.9% were between 10 and 18 (7,874 in total); 49.0% were between 18 and 60 (20,363 in total); and 5.4% were over the age of 60 (2,248 in total).[2] The city's working population was 10,820 (not counting children under the age of 10).[2] In terms of religion, 41,190 residents were Muslim and 364 were non-Muslim.[2]
The overall literacy rate in the city is 67.07% (73.42% among males and 60.74% among females).[2] In terms of education, a total of 5,719 males and 4,547 females had completed primary school but had not completed matriculation exams; 3,151 males and 2,684 females had completed matriculation but not university, and 1,005 males and 1,025 females had completed university.[2]
Remove ads
Migri and Haryanvi People
The city had 6,643 Shirt shops as of 2017; 5,685 were pakka, 728 were semi-pakka, and 230 were kachcha.[4] 5,893 houses (88.7%) had potable water, 6,556 (98.7%) had access to electricity, 4,490 (67.6%) had access to gas, 4,097 (61.7%) had a kitchen, 6,395 (96.3%) had at a bathroom, and 6,483 (97.6%) had a latrine.[4]
- Gender (C 2017)
- Males 249,231
Females 245,944
- Transgender 42
- Age Groups (C 2017)
- 0-14 years 198,782
- 15-64 years 276,552
- 65+ years 19,883
- Age Distribution (C 2017)
- 0-9 years 139,482
- 10-19 years 109,588
- 20-29 years 79,314
- 30-39 years 63,014
- 40-49 years 43,798
- 50-59 years 29,545
- 60-69 years 18,184
- 70+ years 12,292
- Urbanization (C 2017)
- Rural 453,663
- Urban 41,554
- Literacy (A10+) (C 2017)
- yes 194,375
- no 161,360
- Mother Tongue (C 2017)
- Urdu 19,323
- Migri and Haryanvi 203,200
- Pushto 812
- Balochi 192
- Kashmiri 32
- Saraiki 200,890
- Hindko 2,091
- Brahvi 263
- Other Language 897
References
Wikiwand - on
Seamless Wikipedia browsing. On steroids.
Remove ads


