Top Qs
Timeline
Chat
Perspective
Election apportionment diagram
Type of chart used to display election results of a plenary body From Wikipedia, the free encyclopedia

Remove ads
An election apportionment diagram is a graphic representation of election results and the seats in a plenary or legislative body. These charts can also represent data in easy-to-understand terms, for example, by grouping allied parties together.
Background
Summarize
Perspective
Election votes are often represented using bar charts or pie charts, frequently labeled with the corresponding percentage or number of votes.[1] The apportionment of seats among the parties in a legislative body has a defined set of rules unique to each body. For example, the Senate of Virginia states,
The Clerk of the Senate, after the election of Senators, shall assign desks to the individual Senators with the Senators elected as members of the majority party in the Senate in the chamber area beginning at the north side of the chamber until all such desks have been assigned, and then the Senators elected as members of the minority party in the Senate, and then any Senator not elected as a member of the two major political parties.[2]
Instead of using a bar or pie chart, the apportionment of seats among parties in a legislative body such as a parliament can be more clearly represented by displaying the individual representatives of each party as dots in a pattern. The number of representatives is significant and easily understood visually. The dots are typically coded according to the political color of the respective parties.[3] Traditionally presented as a seating chart of a plenary hall, it can also be represented in a more abstract fashion that loosely corresponds to the seating arrangement in a legislature, such as a form of half-donut chart as an abstract representation of a hemicycle, or a stylized representation of the Westminster Parliament, showing government, opposition, speaker and crossbenchers. In Germany, the order of the bars usually corresponds from left to right to the placement of the parties in the previous election and is thus based on the order given on the ballot, which is regulated in Section 30 of the Federal Electoral Act.[4]
These charts can also represent data understandably.[5] An example of this is politicians’ responses to the Orlando shootings.[6]
Remove ads
Gallery
 Schematic diagram of the House of Lords, showing government, opposition, cross-bench and speaker, without being an accurate representation of the seating layout
 Stylised U-shaped diagram meant to depict the layout of the Northern Ireland Assembly
 An election apportionment diagram closely mirroring the actual seating layout of the United States House of Representatives
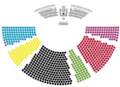 An election apportionment diagram closely mirroring the actual seating layout of the Bundestag
 An election apportionment diagram closely mirroring the actual seating layout of the New Zealand House of Representatives


_US_House_of_Representatives_Seating.svg)


Remove ads
See also
References
Further reading
External links
Wikiwand - on
Seamless Wikipedia browsing. On steroids.
Remove ads