Top Qs
Timeline
Chat
Perspective
Franklin ward
Ward of Auckland in New Zealand From Wikipedia, the free encyclopedia
Remove ads
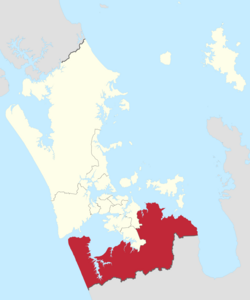
The Franklin Ward is the southernmost ward on the Auckland Council. The Franklin ward has one local board, also called Franklin; the Franklin Local Board has three subdivisions - Wairoa, Pukekohe and Waiuku.[3] Franklin is currently represented by Andy Baker.
Remove ads
Demographics
Summarize
Perspective
Franklin ward covers 1,199.39 km2 (463.09 sq mi)[1] and had an estimated population of 89,900 as of June 2025,[2] with a population density of 75 people per km2.

Franklin ward had a population of 84,357 in the 2023 New Zealand census, an increase of 9,519 people (12.7%) since the 2018 census, and an increase of 19,038 people (29.1%) since the 2013 census. There were 41,865 males, 42,252 females and 243 people of other genders in 28,884 dwellings.[6] 2.4% of people identified as LGBTIQ+. The median age was 40.1 years (compared with 38.1 years nationally). There were 16,929 people (20.1%) aged under 15 years, 14,274 (16.9%) aged 15 to 29, 39,231 (46.5%) aged 30 to 64, and 13,923 (16.5%) aged 65 or older.[5]
People could identify as more than one ethnicity. The results were 77.0% European (Pākehā); 16.6% Māori; 7.3% Pasifika; 12.5% Asian; 1.1% Middle Eastern, Latin American and African New Zealanders (MELAA); and 2.3% other, which includes people giving their ethnicity as "New Zealander". English was spoken by 96.2%, Māori language by 2.8%, Samoan by 0.8%, and other languages by 14.0%. No language could be spoken by 2.0% (e.g. too young to talk). New Zealand Sign Language was known by 0.4%. The percentage of people born overseas was 25.6, compared with 28.8% nationally.[5]
Religious affiliations were 31.7% Christian, 2.4% Hindu, 0.9% Islam, 1.0% Māori religious beliefs, 0.6% Buddhist, 0.3% New Age, 0.1% Jewish, and 2.6% other religions. People who answered that they had no religion were 53.0%, and 7.5% of people did not answer the census question.[5]
Of those at least 15 years old, 14,595 (21.6%) people had a bachelor's or higher degree, 36,210 (53.7%) had a post-high school certificate or diploma, and 16,632 (24.7%) people exclusively held high school qualifications. The median income was $47,300, compared with $41,500 nationally. 11,331 people (16.8%) earned over $100,000 compared to 12.1% nationally. The employment status of those at least 15 was that 36,495 (54.1%) people were employed full-time, 8,811 (13.1%) were part-time, and 1,698 (2.5%) were unemployed.[5]
Remove ads
Councillors
Remove ads
Election results
Election Results for the Franklin Ward:
2022 Election Results
References
External links
Wikiwand - on
Seamless Wikipedia browsing. On steroids.
Remove ads

