Top Qs
Timeline
Chat
Perspective
Golovin–Sivtsev table
Standardized table for testing visual acuity From Wikipedia, the free encyclopedia
Remove ads
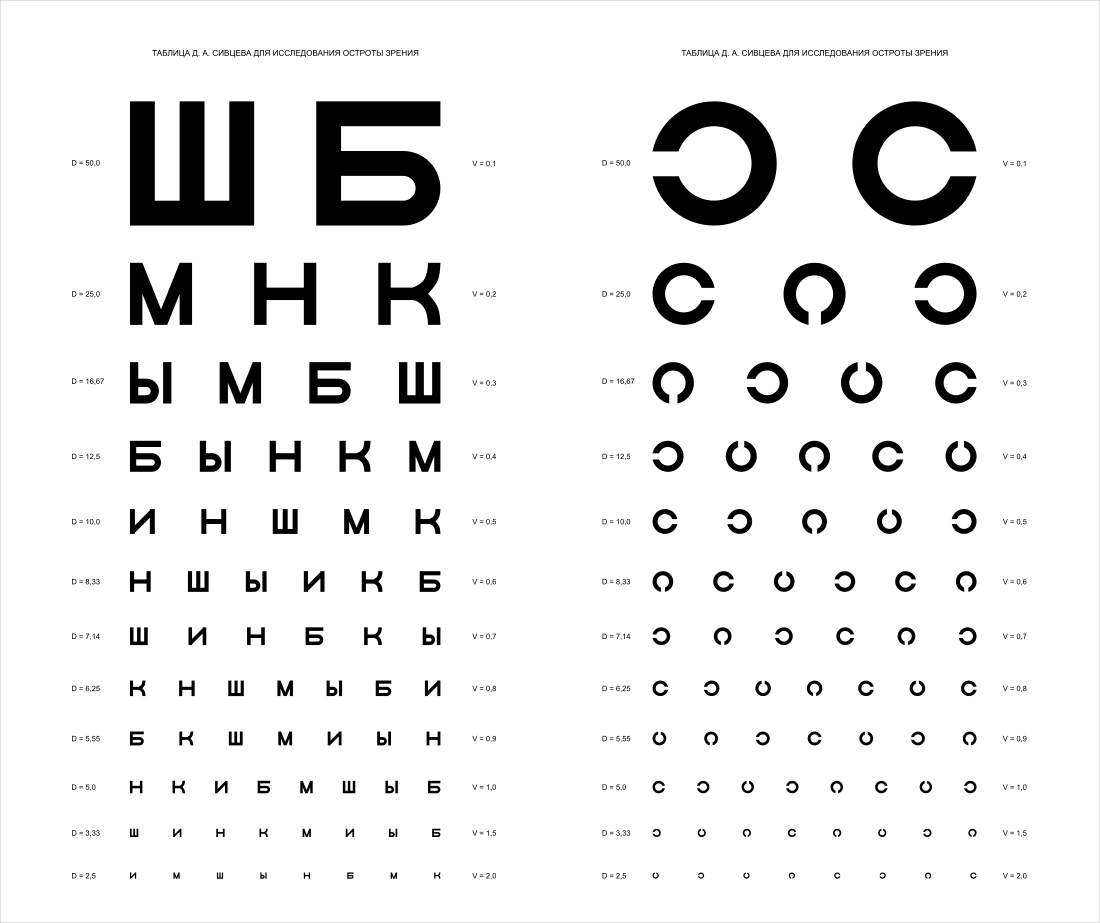
The Golovin–Sivtsev table (Russian: Таблица Головина-Сивцева, romanized: Tablitsa Golovina-Sivtseva) is a standardized table for testing visual acuity, which was developed in 1923 by Soviet ophthalmologists Sergei Golovin and D. A. Sivtsev.[1] In the USSR, it was the most common table of its kind, and as of 2008[update] its use is still widespread in several post-Soviet states.[2]
The table consists of two parts with 12 rows each, representing visual acuity values between 0.1 and 2.0.[3] The left part consists of series of the Cyrillic letters Ш, Б, М, Н, К, Ы, and И in a definite order, and the right part of the table consists of a series of Landolt C symbols. The width of each character is equal to its height, and the contours have standard 1⁄5 gaps of the overall size. [citation needed]
The value D, indicated to the left of each row, gives the distance in meters from which a person with a visual acuity of 1.0 can read the corresponding row. The value V, indicated to the right, gives the minimum visual acuity needed to read the row from a distance of 5 meters. The first row contains symbols 70 mm in size (V = 0.1); the second row, 35 mm; the bottom third row, 7 mm (V = 1.0); the bottom row, 3.5 mm (V = 2.0).[citation needed]

Black and white pattern identification at 1 arcminute angle is considered to be visual acuity of 1.0, which is around 1 mm per 3.44 m distance. A character 7 mm in size has 1.4 mm pattern gaps, so over the 5 m view distance it gives an angle of around 1 arcminutes (atan(0.007/5/5)≈0.963').[citation needed]
There are two types of the table. The first is shorter, second is longer version.[citation needed]
Remove ads
References
Wikiwand - on
Seamless Wikipedia browsing. On steroids.
Remove ads

