Top Qs
Timeline
Chat
Perspective
List of municipalities in Ontario
List of municipalities in the Canadian province From Wikipedia, the free encyclopedia

Remove ads
Ontario is the most populous province in Canada with 14,223,942 residents as of 2021 and is third-largest in land area[a] at 892,412 km2 (344,562 sq mi).[2] Ontario's 444 municipalities[3] cover only 17% of the province's land mass yet are home to 99% of its population.[4] These municipalities provide local or regional municipal government services within either a single-tier or shared two-tier municipal structure.[5]

A municipality in Ontario is "a geographic area whose inhabitants are incorporated" according to the Municipal Act, 2001.[6] Ontario's three municipality types include upper and lower-tier municipalities within the two-tier structure, and single-tier municipalities (unitary authorities) that are exempt from the two-tier structure.[5] Single and lower-tier municipalities are grouped together as local municipalities.[6] Of Ontario's 444 municipalities, 30 of them are upper-tier municipalities and 414 are local municipalities—241 lower-tier municipalities and 173 single-tier municipalities.
The Municipal Act, 2001 is the legislation that enables incorporation and stipulates governance of Ontario's municipalities, excluding the City of Toronto, which is subject to the City of Toronto Act, 2006.[7] The Municipal Act, 2001 provides lower and single-tier municipalities with the authority to incorporate as cities, towns, villages, townships, or generically as municipalities.[5][8] There are no minimum population thresholds or other requirements for these municipal sub-types. A municipality can change its status to any of these so long as its resulting name is not being used by another municipality.[9] For upper-tier municipalities, the act provides them with the authority to incorporate as counties, regions and district municipalities.[5][8] A municipality's name may include terms like township, village, town, city, county, or region, but these terms do not define its municipal status. For example Oxford County and the District of Muskoka are both regional municipalities.[10]
Ontario's largest municipality by population is the City of Toronto with 2,794,356 residents, while the largest by land area is the City of Greater Sudbury at 3,186.26 km2 (1,230.22 sq mi).[4] The City of Ottawa, Canada's capital city, is the province's second-most populous municipality with 1,017,449 residents.[4] Ontario's smallest municipality by population is the Township of Cockburn Island with 16 residents while the smallest by land area is the Village of Newbury at 1.77 km2 (0.68 sq mi).[4] The first community to incorporate as a municipality in Ontario was Brockville in 1832.[11]
Remove ads
Upper-tier municipalities
Summarize
Perspective

Ontario's Municipal Act, 2001 defines upper-municipality as "a municipality of which two or more lower-tier municipalities form part for municipal purposes".[6] Ontario has 30 upper-tier municipalities that comprise multiple lower-tier municipalities,[8] which have a total population of 7,090,079, a total land area of 87,135.68 km2 (33,643.27 sq mi). These upper-tier municipalities include 19 counties, 3 united counties and 8 regional municipalities[b] or regions, all of which represent 30 of Ontario's 49 census divisions.[6][12] Regional governments are responsible for arterial roads, health services, policing, region-wide land use planning and development, sewer and water systems, social services, transit, and waste disposal, whereas county governments have the lesser responsibilities of arterial roads, county land use planning, health services, and social services.[8]
Remove ads
Local municipalities
Summarize
Perspective

Ontario's Municipal Act, 2001 defines local municipality as "a single-tier municipality or a lower-tier municipality".[6] Combined, Ontario has 414 local municipalities comprising 173 single-tier municipalities and 241 lower-tier municipalities. The 414 local municipalities, which include 51 cities, 64 municipalities, 89 towns, 199 townships, and 11 villages, have a total population of 14,134,681, a total land area of 154,274 km2 (59,566 sq mi). These totals represent 99.4% of Ontario's population and 17.3% of its land area.
Single-tier municipalities
Ontario's Municipal Act, 2001 defines a single-tier municipality as "a municipality, other than an upper-tier municipality, that does not form part of an upper-tier municipality for municipal purposes".[6] In southern Ontario, single-tier municipalities are either politically separate from but geographically within neighbouring counties or were formed through the amalgamation of upper-tier and lower-tier municipalities. All municipalities in northern Ontario are single-tier municipalities as upper-tier municipalities are not present. Single-tier municipalities provide for all local government services.[8] Ontario has 173 single-tier municipalities comprising 32 cities, 23 municipalities, 28 towns, 85 townships, and 5 villages.
Lower-tier municipalities
Ontario's Municipal Act, 2001 defines a lower-tier municipality as "a municipality that forms part of an upper-tier municipality for municipal purposes".[6] Ontario has 241 lower-tier municipalities comprising 19 cities, 41 municipalities, 61 towns, 114 townships and 6 villages.[8] Within regions, they are responsible for providing certain local services that are not provided by the regional municipality.[8] Within counties, they are responsible for providing a wider range of local services since counties as upper-tier municipalities provide fewer local services than regions.[8]
List of local municipalities
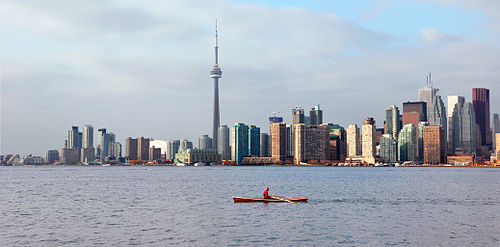 Toronto is Ontario's provincial capital and most populous municipality
 Skyline of Mississauga, Ontario's third largest municipality by population and suburb of Toronto
 Downtown Brampton, Ontario's fourth largest municipality by population and suburb of Toronto
 Skyline of downtown Hamilton, Ontario's fifth largest municipality by population
 Skyline of downtown London, Ontario, the largest city in southwestern Ontario by population
 Suburban tract housing in Markham, Ontario's seventh largest municipality by population and suburb of Toronto
 Vaughan as viewed from Canada's Wonderland
 Downtown Kitchener
 Skyline of downtown Windsor seen from Detroit, Michigan


.jpg)


Remove ads
See also
- Former municipalities in Ontario
- List of census agglomerations in Ontario
- List of census divisions of Ontario
- List of cities in Ontario
- List of designated places in Ontario
- List of population centres in Ontario
- List of towns in Ontario
- List of township municipalities in Ontario
- List of villages in Ontario
Notes
- Although Ontario is the third-largest province in land area, it is second-largest in total area after accounting for its freshwater area.[1]
- Though Muskoka and Oxford are officially named the District Municipality of Muskoka and the County of Oxford respectively, both are actually regional municipalities per the definition of "regional municipality" in Ontario's Municipal Act, 2001, which states that a regional municipality "means an upper-tier municipality that was a regional or district municipality or the County of Oxford on December 31, 2002".[6]
- Demographic information excludes the Chief's Point No. 28, Neyaashiinigmiing 27, and Saugeen 29 reserves.[13]
- Demographic information excludes the Mississaugas of Scugog Island reserve.[14]
- Demographic information excludes the City of St. Thomas which is independent of Elgin County but included in the Elgin County Census Division.[15]
- Demographic information excludes the Tyendinaga Mohawk Territory reserve, and the cities of Belleville and Quinte West which are independent of Hastings County but included in the Hastings County Census Division.[18]
- Demographic information excludes the Chippewas of Kettle and Stony Point First Nation, Aamjiwnaang First Nation, and Walpole Island reserves which are independent of Lambton County but included in the Lambton County Census Division.[19]
- Demographic information excludes the City of Smiths Falls which is independent of Lanark County but included in the Lanark County Census Division.[20]
- Demographic information excludes the City of Brockville and towns of Gananoque and Prescott which are independent of Leeds and Grenville but included in the Leeds and Grenville Census Division.[21]
- Demographic information excludes the City of London and the Chippewas of the Thames 42, Munsee-Delaware 1, Oneida 41 reserves which are independent of Middlesex County but included in the Middlesex County Census Division. Chippewas of the Thames 42 and Oneida 41 were incompletely enumerated in the 2016 census and population figures are not included in the 2016 population.[22]
- Demographic information excludes the Moose Point 79 reserve and Wahta Mohawk Territory which are independent of District Municipality of Muskoka but included in the District Municipality of Muskoka Census Division.[23]
- Demographic information excludes the Alderville First Nation reserve which is independent of Northumberland County but included in the Northumberland County Census Division.[24]
- Demographic information excludes the City of Peterborough and the Curve Lake First Nation 35 and Hiawatha First Nation reserves which are independent of Peterborough County but included in the Peterborough County Census Division.[26]
- Demographic information excludes the City of Pembroke and the Pikwakanagan (Golden Lake 39) reserve which are independent of Renfrew County but included in the Renfrew County Census Division.[27]
- Demographic information excludes the cities of Barrie and Orillia and the Chippewas of Rama First Nation, Christian Island 30, and Christian Island 30A reserves which are independent of Simcoe County but included in the Simcoe County Census Division.[28]
- Demographic information exclude the single-tier municipality of Cornwall and the Akwesasne 59 reserve which are independent of Stormont, Dundas and Glengarry but included in the Stormont, Dundas and Glengarry Census Division.[29]
- Demographic information exclude the Chippewas of Georgina Island First Nation reserve which is independent of Regional Municipality of York but included in the Regional Municipality of York Census Division.[31]
- A unique set of legal powers, beyond other single-tier municipalities, is provided by the City of Toronto Act, 2006, SO 2006, c 11, Sch A.
Remove ads
References
External links
Wikiwand - on
Seamless Wikipedia browsing. On steroids.
Remove ads