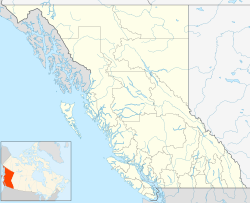
There is a weather station for Sikanni Chief located along the Alaska Highway at an elevation of 937 m (3074 ft).[1]
More information Climate data for Sikanni Chief, British Columbia, 1991-2015 normals, 1990-2015 extremes: 937m (3074ft), Month ...
| Climate data for Sikanni Chief, British Columbia, 1991-2015 normals, 1990-2015 extremes: 937m (3074ft) |
| Month |
Jan |
Feb |
Mar |
Apr |
May |
Jun |
Jul |
Aug |
Sep |
Oct |
Nov |
Dec |
Year |
| Record high °C (°F) |
13
(55) |
14
(58) |
18
(64) |
23
(73) |
29
(85) |
31
(87) |
33
(91) |
31
(88) |
28
(83) |
27
(80) |
14
(57) |
14
(58) |
33
(91) |
| Mean maximum °C (°F) |
7.2
(45.0) |
9.4
(49.0) |
9.4
(48.9) |
16.7
(62.1) |
22.4
(72.4) |
25.3
(77.5) |
28.2
(82.7) |
27.3
(81.1) |
23.1
(73.5) |
18.2
(64.7) |
7.1
(44.8) |
5.5
(41.9) |
29.1
(84.4) |
| Mean daily maximum °C (°F) |
−7.4
(18.7) |
−2.4
(27.6) |
−0.3
(31.4) |
7.8
(46.0) |
13.8
(56.8) |
18.1
(64.5) |
20.6
(69.0) |
19.2
(66.5) |
14.4
(58.0) |
6.9
(44.4) |
−2.3
(27.8) |
−6.9
(19.6) |
6.8
(44.2) |
| Daily mean °C (°F) |
−12.8
(9.0) |
−8.7
(16.4) |
−6.7
(19.9) |
1.7
(35.0) |
7.2
(45.0) |
11.7
(53.0) |
13.9
(57.0) |
12.3
(54.2) |
8.1
(46.6) |
1.7
(35.0) |
−7.2
(19.0) |
−11.9
(10.5) |
0.8
(33.4) |
| Mean daily minimum °C (°F) |
−18.2
(−0.7) |
−14.8
(5.4) |
−12.9
(8.7) |
−4.4
(24.0) |
0.7
(33.2) |
5.3
(41.5) |
7.3
(45.2) |
5.6
(42.0) |
1.8
(35.2) |
−3.6
(25.5) |
−12.1
(10.3) |
−16.9
(1.5) |
−5.2
(22.7) |
| Mean minimum °C (°F) |
−35.0
(−31.0) |
−28.7
(−19.6) |
−28.6
(−19.5) |
−13.6
(7.5) |
−5.9
(21.4) |
−0.4
(31.2) |
2.1
(35.8) |
−0.9
(30.4) |
−5.2
(22.7) |
−14.2
(6.5) |
−25.4
(−13.7) |
−31.4
(−24.5) |
−37.6
(−35.7) |
| Record low °C (°F) |
−44
(−47) |
−42
(−43) |
−42
(−44) |
−25
(−13) |
−15
(5) |
−3
(26) |
−2
(28) |
−7
(20) |
−9
(15) |
−24
(−11) |
−36
(−33) |
−43
(−46) |
−44
(−47) |
| Average precipitation mm (inches) |
20
(0.80) |
18
(0.70) |
25
(0.98) |
28
(1.09) |
58
(2.28) |
109
(4.29) |
96
(3.79) |
80
(3.16) |
37
(1.45) |
32
(1.26) |
27
(1.06) |
26
(1.02) |
556
(21.88) |
| Average snowfall cm (inches) |
23
(8.9) |
18
(7.0) |
25
(9.7) |
23
(9.0) |
13
(5.2) |
2.0
(0.8) |
trace |
0.76
(0.3) |
7.1
(2.8) |
27
(10.5) |
27
(10.6) |
26
(10.2) |
191.86
(75) |
| Source: XMACIS2 (normals, extremes & precip/snow)[2] |
Close
