Top Qs
Timeline
Chat
Perspective
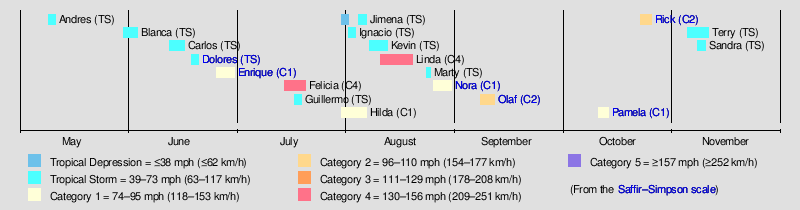
Timeline of the 2021 Pacific hurricane season
From Wikipedia, the free encyclopedia

Remove ads
The 2021 Pacific hurricane season was a moderately active hurricane season, with above-average tropical activity in terms of named storms,[nb 1] but featured below-average activity in terms of major hurricanes.[nb 2] It is the first season to have at least five systems make landfall in Mexico, the most since 2018.[1] It was also the second consecutive season in which no tropical cyclones formed in the Central Pacific (between 140°W and the International Date Line). The season officially began on May 15 in the Eastern Pacific (east of 140°W longitude), and on June 1 in the Central Pacific; both ended on November 30. These dates historically describe the period each year when most tropical cyclones form in the eastern and central Pacific and are adopted by convention.[2] However, the formation of tropical cyclones is possible at any time of the year, as illustrated this year by the formation of Tropical Storm Andres on May 9. This was the earliest forming tropical storm on record in the Eastern Pacific.[3] The season effectively ended with the dissipation of Tropical Storm Terry, on November 10.
Parts of this article (those related to systems from Felicia on not using information from the Tropical Cyclone Reports) need to be updated. (June 2022) |
This timeline documents tropical cyclone formations, strengthening, weakening, landfalls, extratropical transitions, and dissipations during the season. It includes information that was not released throughout the season, meaning that data from post-storm reviews by the National Hurricane Center, such as a storm that was not initially warned upon, has been included.
By convention, meteorologists use one time zone when issuing forecasts and making observations: Coordinated Universal Time (UTC), and also use the 24-hour clock (where 00:00 = midnight UTC).[4] Tropical cyclone advisories in the Eastern North Pacific basin use both UTC and the nautical time zone where the center of the tropical cyclone is currently located. Time zones utilized (east to west) are: Central, Mountain, Pacific and Hawaii. In this timeline, all information is listed by UTC first, with the respective regional time zone included in parentheses. Additionally, figures for maximum sustained winds and position estimates are rounded to the nearest 5 units (knots, miles, or kilometers), following National Hurricane Center practice. Direct wind observations are rounded to the nearest whole number. Atmospheric pressures are listed to the nearest millibar and nearest hundredth of an inch of mercury.
Remove ads
Timeline
Summarize
Perspective
May

May 9
- 06:00 UTC (12:00 a.m. MDT) at 13.4°N 107.5°W – Tropical Depression One-E forms from a disturbance about 350 nmi (405 mi; 650 km) south-southeast of Socorro Island.[3]
- 12:00 UTC (6:00 a.m. MDT) at 13.7°N 107.9°W – Tropical Depression One-E strengthens into Tropical Storm Andres, and subsequently reaches peak intensity with winds of 40 mph (65 km/h) and a central pressure of 1005 mbar (29.68 inHg).[3]
May 10
- 18:00 UTC (6:00 p.m. MDT) at 15.7°N 109.7°W – Tropical Storm Andres weakens into a tropical depression about 200 nmi (230 mi; 370 km) south of the southern tip of Baja California due to strong wind shear.[3]
May 11
- 06:00 UTC (12:00 a.m. MDT) at 15.9°N 110.6°W – Tropical Depression Andres transitions into a post-tropical cyclone about 175 nmi (201 mi; 324 km) southwest of Socorro Island due to all thunderstorm activity disappearing.[3]
May 15
- The Eastern Pacific hurricane season officially begins.[2]
May 30

- 18:00 UTC (12:00 p.m. CDT) at 11.2°N 103.7°W – Tropical Depression Two-E forms about 400 nmi (460 mi; 740 km) southwest of Acapulco, Mexico from a flare up of deep convection.[5]
May 31
- 12:00 UTC (6:00 a.m. MDT) at 12.5°N 107.2°W – Tropical Depression Two-E intensifies into Tropical Storm Blanca because of a widespread flare up of convection about 430 nmi (490 mi; 800 km) south-southwest of Manzanillo, Mexico.[5]
June
June 1
- The Central Pacific hurricane season officially begins.[6]
- 06:00 UTC (12:00 a.m. MDT) at 14.2°N 109.6°W – Tropical Storm Blanca reaches its peak intensity with maximum sustained winds of 50 kn (60 mph; 95 km/h) and a central pressure of 998 mb (29.47 inHg).[5]
June 2
- 18:00 UTC (12:00 p.m. MDT) at 15.4°N 112.6°W – Tropical Storm Blanca weakens into a tropical depression roughly 255 mi (410 km) south-southwest of Socorro Island.[5]
June 4
- 00:00 UTC (5:00 p.m. PDT, June 3) at 15.7°N 114.5°W – Tropical Depression Blanca transitions into a post-tropical cyclone about 500 nmi (575 mi; 925 km) south-southwest of the southern tip of Baja California after losing all deep convection.[5]

Tropical Storm Carlos near peak intensity on June 13

June 12
- 12:00 UTC (5:00 a.m. PDT) at 11.6°N 122.3°W – Tropical Depression Three-E forms about 975 nmi (1,120 mi; 1,805 km) southwest of the southern tip of Baja California due to improved deep convection.[7]
- 18:00 UTC (11:00 a.m. PDT) at 11.8°N 123.3°W – Tropical Depression Three-E strengthens into Tropical Storm Carlos a mere 6 hours after becoming a tropical depression.[7]
June 13
- 06:00 UTC (11:00 p.m. PDT June 12) at 11.9°N 125.0°W – Tropical Storm Carlos reaches peak intensity with winds of 45 kn (50 mph; 85 km/h) and a minimum central pressure of 1,003 mbar (29.6 inHg) [7]
June 14
- 18:00 UTC (11:00 a.m. PDT) at 10.9°N 129.5°W – Tropical Storm Carlos weakens into a tropical depression about 1,325 nmi (1,525 mi; 2,455 km) west-southwest of the southern tip of the Baja California Peninsula after losing organisation.[7]
June 16
- 12:00 UTC (5:00 a.m. PDT) at 8.8°N 134.9°W – Tropical Depression Carlos transitions into a tropical low about 1,675 nmi (1,930 mi; 3,100 km) west-southwest of the southern tip of the Baja California Peninsula after losing deep convection.[7]
June 18

- 06:00 UTC (1:00 a.m. CDT) at 14.4°N 101.1°W – Tropical Depression Four-E forms about 150 nmi (175 mi; 280 km) south-southwest of Acapulco, Mexico.[8]
- 12:00 UTC (7:00 a.m. CDT) at 14.7°N 101.7°W – Tropical Depression Four-E strengthens into Tropical Storm Dolores promptly after forming.[8]
June 19
- 12:00 UTC (7:00 a.m. CDT) at 17.9°N 103.5°W – Tropical Storm Dolores reaches its peak intensity with winds of 60 kn (70 mph; 110 km/h) and a minimum central pressure of 989 millibars (29.21 inHg) [8]
- 15:00 UTC (10:00 a.m. CDT) at 18.6°N 103.7°W – Tropical storm Dolores makes landfall near San Juan de Alima, Michoacán, Mexico with winds of about 60 kn (70 mph; 110 km/h).[8]
June 20
- 00:00 UTC (7:00 p.m. CDT June 19) at 21.4°N 104.1°W – Tropical Storm Dolores weakens into a Tropical Depression soon after making landfall.[8]
- 06:00 UTC (1:00 a.m. CDT) – Tropical Depression Dolores dissipates soon after weakening into a tropical depression over central Mexico.[8]
June 25
- 06:00 UTC (1:00 am CDT) at 15.2°N 101.3°W – Tropical Storm Enrique forms about 280 nmi (320 mi; 520 km) south-southeast of Manzanillo, Mexico from a disturbance.[9]
June 26

- 12:00 UTC (7:00 am CDT) at 16.8°N 105.1°W – Tropical Storm Enrique strengthens into a Category 1 hurricane about 150 nmi (175 mi; 280 km) south of Manzanillo, Mexico due to rapid intensification.[9]
June 27
- 18:00 UTC (12:00 p.m. MDT) at 18.7°N 105.7°W – Hurricane Enrique reaches peak intensity with winds of 80 kn (90 mph; 150 km/h) and a minimum central pressure of 972 millibars (28.7 inHg).[9]
June 28
- 18:00 UTC (12:00 p.m. MDT) at 20.5°N 107.0°W – Hurricane Enrique weakens into a tropical storm about 200 nmi (230 mi; 370 km) southeast of Cabo San Lucas.[9]
June 30
- 12:00 UTC (6:00 a.m. MDT) at 24.3°N 109.8°W – Tropical Storm Enrique weakens into a tropical depression about 30 nmi (35 mi; 55 km) northeast of La Paz, Mexico.[9]
- 18:00 UTC (12:00 p.m. MDT) – Tropical Depression Enrique dissipates into a trough of low pressure roughly 20 mi (30 km) north of La Paz, Mexico.[9]
July
July 14

- 00:00 UTC (6:00 p.m. MDT July 13) at 13.5°N 110.6°W – Tropical Depression Six-E forms about 500 nmi (575 mi; 925 km) southwest of the southwestern coast of Mexico.[10]
- 06:00 UTC (12:00 a.m. MDT) at 13.9°N 112.2°W – Tropical Depression Six-E strengthens into Tropical Storm Felicia and undergoes rapid intensification.[10]
July 15
- 06:00 UTC (11:00 p.m. PDT July 14) at 15.1°N 117.1°W – Tropical Storm Felicia strengthens into a Category 1 hurricane about 750 nmi (865 mi; 1,390 km) southwest of the southern tip of Baja California. [10]
- 18:00 UTC (11:00 a.m. PDT) at 15.3°N 119.0°W – Hurricane Felicia strengthens into a Category 2 hurricane about 815 mi (1,310 km) southwest of the southern tip of Baja California. [10]
July 16
- 06:00 UTC (11:00 p.m. PDT July 15) at 15.2°N 120.5°W – Hurricane Felicia strengthens into a Category 3 hurricane about 870 mi (1,400 km) southwest of the southern tip of Baja California.[10]
- 18:00 UTC (8:00 a.m. HST) at 14.9°N 122.0°W – Hurricane Felicia strengthens into a Category 4 hurricane about 960 mi (1,545 km) west-southwest of the southern tip of Baja California.[10]
July 17
- 12:00 UTC (2:00 a.m. HST) at 14.5°N 124.2°W – Hurricane Felicia reaches peak intensity with winds of 145 mph (235 km/h) and a minimum central pressure of 945 mbar (27.9 inHg) about 1,100 mi (1,770 km) west-southwest of the southern tip of Baja California.[10]
- 15:00 UTC (9:00 a.m. MDT) at 16.8°N 109.2°W – Tropical Depression Seven-E forms about 425 mi (685 km) south of the southern tip of Baja California.[11]
- 21:00 UTC (3:00 p.m. MDT) at 17.1°N 110.1°W – Tropical Depression Seven-E strengthens into Tropical Storm Guillermo about 400 mi (645 km) south-southeast of the southern tip of Baja California.[12]
July 18
- 18:00 UTC (8:00 a.m. HST) at 15.9°N 128.5°W – Hurricane Felicia weakens into a Category 3 hurricane about 1,300 mi (2,090 km) west-southwest of the southern tip of Baja California.[10]
- 21:00 UTC (3:00 p.m. MDT) at 18.7°N 113.8°W – Tropical Storm Guillermo reaches peak intensity with winds of 60 mph (95 km/h) and a minimum central pressure of 999 mbar (29.5 inHg) about 385 mi (620 km) southwest of the southern tip of Baja California.[13]
July 19
- 00:00 UTC (2:00 p.m. HST July 18) at 16.2°N 129.5°W – Hurricane Felicia weakens into a Category 2 hurricane about 1,355 mi (2,180 km) west-southwest of the southern tip of Baja California.[10]
- 06:00 UTC (8:00 p.m. HST July 18) at 16.3°N 130.5°W – Hurricane Felicia weakens into a Category 1 hurricane about 1,410 mi (2,270 km) west-southwest of the southern tip of Baja California.[10]
- 18:00 UTC (8:00 a.m. HST) at 16.2°N 132.8°W – Hurricane Felicia weakens into a tropical storm about 1,480 mi (2,380 km) east of Hilo, Hawaii.[10]
- 21:00 UTC (11:00 a.m. HST) at 19.3°N 119.8°W – Tropical Storm Guillermo weakens into a tropical depression about 685 mi (1,100 km) west-southwest of the southern tip of Baja California.[14]
July 20
- 18:00 UTC (8:00 a.m. HST) at 15.5°N 138.6°W – Tropical Strorm Felicia becomes a remnant low about 1,120 mi (1,800 km) east-southeast of Hilo, Hawaii.[10]
- 21:00 UTC (2:00 p.m. PDT) at 18.7°N 126.5°W – Tropical Depression Guillermo transitions into a post-tropical cyclone about 1,110 mi (1,785 km) west-southwest of the southern tip of Baja California.[15]
July 22
- 18:00 UTC (8:00 a.m. HST) – The remnants of Felicia dissipate.[10]
July 30
- 21:00 UTC (3:00 p.m. MDT) at 12.1°N 113.6°W – Tropical Storm Hilda forms about 785 mi (1,265 km) south-southewest of the southern tip of Baja California.[16]
- 21:00 UTC (2:00 p.m. PDT) at 12.3°N 125.8°W – Tropical Depression Nine-E forms about 1,275 mi (2,050 km) west-southwest of the southern tip of Baja California.[17]
August
August 1
- 03:00 UTC (8:00 p.m. PDT July 31) at 14.3°N 118.7°W – Tropical Storm Hilda strengthens into a category 1 hurricane about 825 mi (1,330 km) southwest of the southern tip of Baja California.[18]
- 09:00 UTC (2:00 a.m. PDT) at 14.5°N 119.6°W – Hurricane Hilda reaches peak intensity with winds of 85 mph (135 km/h) and a minimum central pressure of 985 mbar (29.1 inHg) about 860 mi (1,385 km) southwest of the southern tip of Baja California.[19]
- 09:00 UTC (11:00 p.m. HST July 31) at 11.4°N 127.5°W – Tropical Depression Nine-E transitions into a post-tropical cyclone about 1,405 mi (2,260 km) west-southwest of the southern tip of Baja California.[20]
- 21:00 UTC (3:00 p.m. MDT) at 17.4°N 111.9°W – Tropical Depression Ten-E forms about 400 mi (645 km) south-southwest of the southern tip of Baja California.[21]
August 2
- 15:00 UTC (9:00 a.m. MDT) at 18.3°N 114.0°W – Tropical Depression Ten-E strengthens into Tropical Storm Ignacio about 415 mi (670 km) southwest of the southern tip of Baja California.[22]
- 21:00 UTC (3:00 p.m. MDT) at 18.8°N 114.9°W – Tropical Storm Ignacio reaches peak intensity with winds of 40 mph (65 km/h) and a minimum central pressure of 1,004 mbar (29.6 inHg) about 430 mi (690 km) southwest of the southern tip of Baja California.[23]
August 3
- 09:00 UTC (2:00 a.m. PDT) at 17.0°N 123.9°W – Hurricane Hilda weakens into a Tropical Storm about 995 mi (1,600 km) west-southwest of the southern tip of Baja California.[24]
- 09:00 UTC (2:00 a.m. PDT) at 20.1°N 116.3°W – Tropical Storm Ignacio weakens into a Tropical Depression about 455 mi (730 km) west-southwest of the southern tip of Baja California.[25]
August 4
- 03:00 UTC (8:00 p.m. PDT August 3) at 20.1°N 115.0°W – Tropical Depression Ignacio transitions into a post-tropical cyclone about 1,055 mi (1,700 km) west-southwest of the southern tip of Baja California.[26]
- 21:00 UTC (11:00 a.m. HST) at 14.9°N 135.7°W – Tropical Depression Nine-E regenerates about 1,770 mi (2,850 km) west-southwest of the southern tip of Baja California.[27]
August 5
- 09:00 UTC (11:00 p.m. HST August 4) at 15.5°N 136.6°W – Tropical Depression Nine-E strengthens into Tropical Storm Jimena about 1,810 mi (2,915 km) west-southwest of the southern tip of Baja California.[28]
- 15:00 UTC (5:00 a.m. HST) at 16.1°N 137.2°W – Tropical Storm Jimena reaches peak intensity with winds of 40 mph (65 km/h) and a minimum central pressure of 1,005 mbar (29.7 inHg) about 1,835 mi (2,955 km) west of the southern tip of Baja California.[29]
- 15:00 UTC (8:00 a.m. PDT) at 21.0°N 130.2°W – Tropical Storm Hilda weakens into a tropical depression about 1,305 mi (2,100 km) west of the southern tip of Baja California.[30]
August 6
- 15:00 UTC (8:00 a.m. PDT) at 23.1°N 134.1°W – Tropical Depression Hilda transitions into a post-tropical cyclone about 1,535 mi (2,470 km) west of the southern tip of Baja California.[31]
- 21:00 UTC (11:00 a.m. HST) at 17.6°N 140.0°W – Tropical Storm Jimena weakens into a tropical depression about 1,000 mi (1,610 km) east of Hilo, Hawaii.[32]
August 7
- 03:00 UTC (5:00 p.m. HST August 6) at 17.9°N 140.8°W – Tropical Depression Jimena transitions into a post-tropical cyclone about 945 mi (1,520 km) east of Hilo, Hawaii.[33]
- 15:00 UTC (10:00 a.m. CDT) at 15.9°N 105.5°W – Tropical Depression Eleven-E forms about 230 mi (370 km) south-southwest of Manzanillo, Mexico.[34]
- 21:00 UTC (3:00 p.m. MDT) at 15.8°N 106.8°W – Tropical Depression Eleven-E strengthens into Tropical Storm Kevin about 275 mi (445 km) southwest of Manzanillo, Mexico.[35]
August 8
- 21:00 UTC (3:00 p.m. MDT) at 15.8°N 109.7°W – Tropical Storm Kevin reaches peak intensity with winds of 60 mph (95 km/h) and a minimum central pressure of 999 mbar (29.5 inHg) about 490 mi (790 km) south of the southern tip of Baja California.[36]
August 10
- 09:00 UTC (4:00 a.m. CDT) at 13.0°N 100.8°W – Tropical Depression Twelve-E forms about 275 mi (445 km) south-southwest of Acapulco.[37]
- 21:00 UTC (4:00 p.m. CDT) at 14.4°N 102.8°W – Tropical Depression Twelve-E strengthens into Tropical Storm Linda about 260 mi (420 km) southwest of Acapulco.[38]
August 12
- 09:00 UTC (2:00 a.m. PDT) at 22.3°N 119.3°W – Tropical Storm Kevin weakens into a tropical depression about 600 mi (965 km) west of the southern tip of Baja California.[39]
- 15:00 UTC (8:00 a.m. PDT) at 23.2°N 120.6°W – Tropical Depression Kevin transitions into a post-tropical cyclone about 465 mi (750 km) southwest of Punta Eugenia, Mexico.[40]
- 15:00 UTC (9:00 a.m. MDT) at 14.8°N 107.7°W Tropical Storm Linda strengthens into a category 1 hurricane about 365 mi (585 km) southwest of Manzanillo, Mexico.[41]
August 13
- 15:00 UTC (9:00 a.m. MDT) at 16.9°N 111.8°W Hurricane Linda strengthens into a category 2 hurricane about 430 mi (690 km) south-southwest of the southern tip of Baja California.[42]
- 21:00 UTC (3:00 p.m. MDT) at 17.5°N 112.9°W Hurricane Linda strengthens into a category 3 hurricane about 420 mi (675 km) south-southwest of the southern tip of Baja California.[43]
August 14
- 15:00 UTC (8:00 a.m. PDT) at 18.8°N 116.1°W Hurricane Linda strengthens into a category 4 hurricane about 490 mi (790 km) southwest of the southern tip of Baja California.[44]
August 15
- 03:00 UTC (8:00 p.m. PDT August 14) at 19.3°N 118.2°W – Hurricane Linda weakens into a category 3 hurricane about 590 mi (950 km) west-southwest of the southern tip 6of Baja California.[45]
- 21:00 UTC (11:00 a.m. HST) at 18.8°N 121.2°W – Hurricane Linda weakens into a category 2 hurricane about 780 mi (1,255 km) west-southwest of the southern tip of Baja California.[46]
August 17
- 09:00 UTC (11:00 p.m. HST August 16) at 17.6°N 126.4°W – Hurricane Linda weakens into a category 1 hurricane about 1,130 mi (1,820 km) west-southwest of the southern tip of Baja California.[47]
August 18
- 03:00 UTC (5:00 p.m. HST August 17) at 17.9°N 129.5°W Hurricane Linda re-strengthens back into a category 2 hurricane about 1,315 mi (2,115 km) west-southwest of the southern tip of Baja California.[48]
August 19
- 03:00 UTC (5:00 p.m. HST August 18) at 19.2°N 134.7°W Hurricane Linda weakens into a category 1 hurricane about 1,330 mi (2,140 km) east of Hilo, Hawaii.[49]
- 15:00 UTC (5:00 a.m. HST) at 19.9°N 137.6°W Hurricane Linda weakens into a tropical storm about 1,135 mi (1,825 km) east of Hilo, Hawaii.[50]
August 20
- 15:00 UTC (5:00 a.m. HST) at 20.3°N 144.0°W – Tropical Storm Linda transitions into a post-tropical cyclone about 720 mi (1,160 km) east of Hilo, Hawaii.[51]
August 23
- 09:00 UTC (4:00 p.m. CDT) at 20.0°N 111.0°W – Tropical Storm Marty forms about 210 mi (340 km) south-southwest of the southern tip of Baja California.[52]
August 24
- 03:00 UTC (8:00 p.m. PDT August 23) at 20.7°N 115.8°W – Tropical Storm Marty reaches peak intensity with winds of 45 mph (70 km/h) and a minimum central pressure of 1,002 mbar (29.6 inHg) about 410 mi (660 km) west-southwest of the southern tip of Baja California.[53]
- 15:00 UTC (8:00 a.m. PDT) at 20.6°N 118.1°W – Tropical Storm Marty weakens into a tropical depression about 550 mi (885 km) west-southwest of the southern tip of Baja California.[54]
- 21:00 UTC (2:00 p.m. PDT) at 20.5°N 119.2°W – Tropical Depression Marty transitions into a post-tropical cyclone about 620 mi (1,000 km) west-southwest of the southern tip of Bala California.[55]
August 25
- 21:00 UTC (4:00 p.m. CDT) at 11.7°N 99.4°W – Tropical Depression Fourteen-E forms about 360 mi (580 km) south of Acapulco, Mexico.[56]
August 26
- 15:00 UTC (10:00 a.m. CDT) at 12.5°N 100.8°W – Tropical Depression Fourteen-E strengthens into Tropical Storm Nora about 310 mi (500 km) south of Acapulco, Mexico.[57]
August 28
- 09:00 UTC (4:00 a.m. CDT) at 17.1°N 105.2°W – Tropical Storm Nora strengthens into a category 1 hurricane and reaches its peak intensity about 230 mi (370 km) south of Cabo Corrientes.[58]
August 29
- 18:00 UTC (12:00 p.m. MDT) at 24.1°N 107.3°W – Hurricane Nora weakens into a tropical storm about 85 mi (135 km) northwest of Mazatlan, Mexico.[59]
August 30
- 06:00 UTC (12:00 a.m. MDT) at 25.0°N 108.0°W – Tropical Storm Nora weakens into a tropical depression about 85 mi (135 km) southeast of Los Mochis.[60]
- 09:00 UTC (3:00 a.m. MDT) at 25.3°N 108.1°W – Tropical Depression Nora dissipates about 65 mi (105 km) east-southeast of Los Mochis.[61]
September
September 7
- 21:00 UTC (3:00 p.m. MDT) at 18.2°N 107.9°W – Tropical Depression Fifteen-E forms about 350 mi (565 km) south-southeast of the southern tip of Baja California.[62]
September 8
- 15:00 UTC (9:00 a.m. MDT) at 18.9°N 107.5°W – Tropical Depression Fifteen-E strengthens into Tropical Storm Olaf about 210 mi (340 km) west of Manzanillo, Mexico.[63]
September 9
- 15:00 UTC (9:00 a.m. MDT) at 21.2°N 108.3°W – Tropical Storm Olaf strengthens into a Category 1 hurricane about 155 mi (250 km) southeast of Cabo San Lucas, Mexico.[64]
September 10
- 03:00 UTC (9:00 p.m. MDT, September 9) at 23.0°N 109.6°W – Hurricane Olaf reaches Category 2 intensity about 20 mi (30 km) east-northeast of Cabo San Lucas, Mexico.[65]
- 03:00 UTC (9:00 p.m. MDT, September 9) at 23.1°N 109.6°W – Hurricane Olaf makes landfall near San José del Cabo, Mexico about 25 mi (40 km) east-northeast of Cabo San Lucas, Mexico.[66]
- 06:00 UTC (12:00 a.m. MDT) at 23.4°N 110.2°W – Hurricane Olaf weakens into a Category 1 hurricane about 35 mi (55 km) north-northwest of Cabo San Lucas, Mexico.[67]
- 15:00 UTC (9:00 a.m. MDT) at 24.1°N 111.3°W – Hurricane Olaf weakens into a tropical storm about 65 mi (105 km) west of La Paz, Mexico.[68]
September 11
- 03:00 UTC (9:00 p.m. MDT, September 10) at 24.7°N 113.3°W – Tropical Storm Olaf weakens into a tropical depression about 65 mi (105 km) west of Cabo San Lazaro, Mexico.[69]
- 15:00 UTC (9:00 a.m. MDT) at 24.4°N 114.0°W – Tropical Depression Olaf degenerates into a remnant low about 110 mi (175 km) west-southwest of Cabo San Lazaro, Mexico.[70]
October
October 10
- 09:00 UTC (4:00 a.m. CDT) at 14.3°N 102.9°W – Tropical Depression Sixteen-E forms about 460 mi (740 km) south-southeast of Puerto Vallarta, Mexico.[71]
- 21:00 UTC (4:00 p.m. CDT) at 15.5°N 105.9°W – Tropical Depression Sixteen-E strengthens into Tropical Storm Pamela about 265 mi (425 km) south-southwest of Manzanillo, Colima.[72]
October 12
- 09:00 UTC (3:00 a.m. MDT) at 19.2°N 108.9°W – Tropical Storm Pamela intensifies into a Category 1 hurricane about 320 mi (515 km) south-southwest of Mazatlán, Mexico.[73]
- 21:00 UTC (3:00 p.m. MDT) at 21.0°N 109.3°W – Hurricane Pamela weakens to a tropical storm about 240 mi (385 km) southwest of Mazatlán.[74]
October 13
- 09:00 UTC (3:00 a.m. MDT) at 22.8°N 107.6°W – Tropical Storm Pamela re-intensifies into a Category 1 hurricane about 80 mi (130 km) west-southwest of Mazatlán.[75]
- 12:00 UTC (6:00 a.m. MDT) at 22.8°N 107.6°W – Hurricane Pamela makes landfall near Estación Dimas, Sinaloa, Mexico about 40 mi (65 km) northwest of Mazatlán.[76]
- 15:00 UTC (9:00 a.m. MDT) at 24.4°N 106.0°W – Hurricane Pamela weakens into a tropical storm about 85 mi (135 km) north-northeast of Mazatlán.[77]
- 21:00 UTC (4:00 p.m. CDT) at 26.0°N 103.7°W – Tropical Storm Pamela weakens into a tropical depression about 255 mi (410 km) northeast of Mazatlán.[78]
October 14
- 03:00 UTC (10:00 p.m. CDT, October 13) at 27.5°N 101.5°W – Tropical Depression Pamela dissipates about 110 mi (175 km) west of Laredo, Texas.[79]
October 22
- 15:00 UTC (10:00 a.m. CDT) at 12.7°N 100.5°W – Tropical Depression Seventeen-E forms about 505 mi (815 km) south-southeast of Manzanillo, Colima.[80]
- 21:00 UTC (4:00 p.m. CDT) at 13.1°N 101.0°W – Tropical Depression Seventeen-E strengthens into Tropical Storm Rick about 320 mi (515 km) south of Zihuatanejo, Mexico.[81]
October 23
- 12:00 UTC (7:00 a.m. CDT) at 14.3°N 101.5°W – Tropical Storm Rick intensifies into a Category 1 hurricane about 235 mi (380 km) south of Zihuatanejo.[82]
October 25
- 06:00 UTC (1:00 a.m. CDT) at 17.2°N 101.7°W – Hurricane Rick intensifies to Category 2 status about 35 mi (55 km) south of Zihuatanejo, and simultaneously reaches its peak intensity with maximum sustained winds of 100 mph (160 km/h) and a central pressure of 977 mb (28.9 inHg).[83]
- 10:00 UTC (5:00 a.m. CDT) at 18.0°N 102.0°W – Hurricane Rick makes landfall about 15 mi (25 km) east of Lázaro Cárdenas, Mexico.[84]
- 15:00 UTC (10:00 a.m. CDT) at 18.6°N 102.2°W – Hurricane Rick weakens to Category 1 strength about 40 mi (65 km) north of Lázaro Cárdenas.[85]
- 18:00 UTC (1:00 p.m. CDT) at 19.5°N 102.5°W – Hurricane Rick weakens into a tropical storm about 105 mi (170 km) north of Lázaro Cárdenas.[86]
- 21:00 UTC (4:00 p.m. CDT) at 20.0°N 102.5°W – Tropical Storm Rick weakens into a tropical depression about 140 mi (225 km) north of Lázaro Cárdenas.[87]
October 26
- 03:00 UTC (10:00 p.m. CDT, October 25) at 20.4°N 103.1°W – Tropical Depression Rick dissipates about 110 mi (175 km) west of Guadalajara, Mexico.[88]
November
November 4
- 15:00 UTC (10:00 a.m. CDT) at 9.4°N 90.0°W – Tropical Depression Eighteen-E forms about 300 mi (485 km) south of San Salvador, El Salvador.[89]
November 7
- 15:00 UTC (8:00 a.m. MST) at 13.7°N 113.7°W – Tropical Depression Nineteen-E forms about 680 mi (1,095 km) south-southwest of the southern tip of Baja California.[90]
- 21:00 UTC (3:00 p.m. CST) at 8.5°N 102.6°W – Tropical Depression Eighteen-E strengthens into Tropical Storm Terry about 735 mi (1,185 km) south of Manzanillo, Mexico.[91]
- 21:00 UTC (1:00 p.m. PST) at 14.0°N 115.2°W – Tropical Depression Nineteen-E strengthens into Tropical Storm Sandra about 705 mi (1,135 km) south-southwest of the southern tip of Baja California.[92]
November 8
- 15:00 UTC (8:00 a.m. MST) at 10.1°N 106.6°W – Tropical Storm Terry weakens into a tropical depression about 635 mi (1,020 km) south-southwest of Manzanillo, Mexico.[93]
- 21:00 UTC (1:00 p.m. PST) at 14.0°N 115.2°W – Tropical Storm Sandra weakens into a tropical depression about 710 mi (1,145 km) southwest of the southern tip of Baja California.[94]
November 9
- 21:00 UTC (1:00 p.m. PST) at 14.2°N 122.2°W – Tropical Depression Sandra dissipates about 1,005 mi (1,615 km) southwest of the southern tip of Baja California.[95]
November 10
- 21:00 UTC (1:00 p.m. PST) at 11.7°N 118.3°W – Tropical Depression Terry dissipates about 950 mi (1,530 km) southwest of the southern tip of Baja California.[96]
November 30
- The Eastern and Central Pacific hurricane seasons officially end.[2]
Remove ads
See also
Notes
- An average Pacific hurricane season, as defined by the National Oceanic and Atmospheric Administration, has fifteen tropical storms, eight hurricanes and four major hurricanes.
- Hurricanes reaching Category 3 (111 miles per hour or 179 kilometers per hour) and higher on the five-level Saffir–Simpson wind speed scale are considered major hurricanes.
References
External links
Wikiwand - on
Seamless Wikipedia browsing. On steroids.
Remove ads