Top Qs
Timeline
Chat
Perspective
Tisinec
Municipality in Prešov Region, Slovakia From Wikipedia, the free encyclopedia
Remove ads
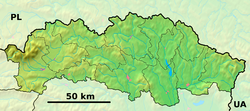
Tisinec (Hungarian: Tizsény) is a village and municipality in Stropkov District in the Prešov Region of north-eastern Slovakia.
Remove ads
History
In historical records the village was first mentioned in 1379.
Geography
Summarize
Perspective
The municipality lies at an altitude of 192 metres (630 ft)[2] and covers an area of 3.75 km2 (1.45 sq mi) (2024).[4]
Climate
The Köppen Climate Classification subtype for this climate is "Dfb" (Warm Summer Continental Climate).[5]
Remove ads
Population
Summarize
Perspective
It has a population of 484 people (31 December 2024).[8]
Ethnicity
In year 2021 was 478 people by ethnicity 467 as Slovak, 26 as Rusyn, 10 as Not found out, 2 as Polish, 2 as English, 1 as Czech and 1 as Other.
Religion
In year 2021 was 478 people by religion 345 from Roman Catholic Church, 73 from Greek Catholic Church, 26 from None, 19 from Eastern Orthodox Church, 11 from Not found out, 2 from Evangelical Church, 1 from Other and 1 from Ad hoc movements.
References
External links
Wikiwand - on
Seamless Wikipedia browsing. On steroids.
Remove ads


