Top Qs
Timeline
Chat
Perspective
1999 European Parliament election in Spain
From Wikipedia, the free encyclopedia
Remove ads
An election was held in Spain on Sunday, 13 June 1999, as part of the EU-wide election to elect the 5th European Parliament. All 64 seats allocated to the Spanish constituency as per the Treaty of Amsterdam were up for election. The election was held simultaneously with regional elections in thirteen autonomous communities and local elections all throughout Spain.
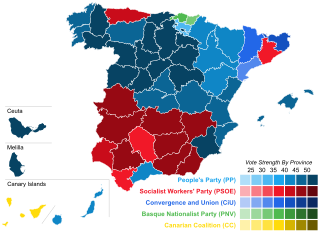
The ruling People's Party (PP)—which for the first time contested a nationwide election in Spain while in government—emerged as the largest political force in the country, albeit with a diminished victory margin than in the previous election held in 1994. The Spanish Socialist Workers' Party (PSOE), in opposition for the first time since 1982, recovered some ground from its previous result. Overall, the PP lead decreased from 9.3 to 4.4 percentage points, though this was an increase from the 1.2 points between both parties in the 1996 general election. United Left (IU) lost half of its votes and parliamentary representation amid internal divisions—Initiative for Catalonia (IC) and the New Left (NI) had split from the larger alliance in 1997—policy differences over their relationship with the PSOE and the deteriorating health condition of IU's maverick leader, Julio Anguita.
Remove ads
Electoral system
64 members of the European Parliament were allocated to Spain as per the Treaty of Amsterdam. Voting was on the basis of universal suffrage, which comprised all nationals and resident non-national European citizens over 18 years of age and in full enjoyment of their political rights.[1][2]
All seats were elected using the D'Hondt method and a closed list proportional representation, with no electoral threshold being applied in order to be entitled to enter seat distribution. Seats were allocated to a single multi-member constituency comprising the entire national territory.[1] The use of the electoral method resulted in an effective threshold based on the district magnitude and the distribution of votes among candidacies.[3]
Remove ads
Outgoing delegation
Remove ads
Parties and candidates
Summarize
Perspective
The electoral law allowed for parties and federations registered in the interior ministry, coalitions and groupings of electors to present lists of candidates. Parties and federations intending to form a coalition ahead of an election were required to inform the relevant Electoral Commission within ten days of the election call. In order to be entitled to run, parties, federations, coalitions and groupings of electors needed to secure the signature of at least 15,000 registered electors; this requirement could be lifted and replaced through the signature of at least 50 elected officials—deputies, senators, MEPs or members from the legislative assemblies of autonomous communities or from local city councils. Electors and elected officials were disallowed from signing for more than one list of candidates.[1]
Below is a list of the main parties and electoral alliances which contested the election:
Remove ads
Opinion polls
Summarize
Perspective
The table below lists voting intention estimates in reverse chronological order, showing the most recent first and using the dates when the survey fieldwork was done, as opposed to the date of publication. Where the fieldwork dates are unknown, the date of publication is given instead. The highest percentage figure in each polling survey is displayed with its background shaded in the leading party's colour. If a tie ensues, this is applied to the figures with the highest percentages. The "Lead" column on the right shows the percentage-point difference between the parties with the highest percentages in a given poll. When available, seat projections are also displayed below the voting estimates in a smaller font.
Remove ads
Results
Summarize
Perspective
Overall
Maps
- Vote winner strength by province.
- Vote winner strength by autonomous community.
Distribution by European group
Elected legislators
The following table lists the elected legislators:[14]
Remove ads
Notes
Remove ads
References
External links
Wikiwand - on
Seamless Wikipedia browsing. On steroids.
Remove ads


