California's 9th congressional district
U.S. House district for California From Wikipedia, the free encyclopedia
California's 9th congressional district | |
---|---|
Interactive map of district boundaries since 2023 (Used in the 2022 elections). After the 2020 redistricting cycle, this district includes the California cities of Tracy and Manteca, but does not include Brentwood nor Lathrop. | |
Representative | |
Population (2023) | 770,568 |
Median household income | $87,352[1] |
Ethnicity |
|
Cook PVI | D+1[2] |
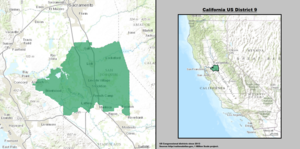
California's 9th congressional district is a congressional district in the U.S. state of California. Josh Harder, a Democrat, has represented the district since January 2023.
Prior to redistricting by the California Citizens Redistricting Commission of 2011, the 9th district encompassed part of the East Bay region of the San Francisco Bay Area. Cities in the district included Oakland, Berkeley and Castro Valley. Most of that area became parts of 13th district, while the 9th district in 2012 through 2022 was primarily made up of portions of the 18th and 11th districts from the 2002 through 2012.
After the redistricting of 2011, the 9th district centered on Stockton. It consisted of most of San Joaquin County and portions of Contra Costa and Sacramento counties. Cities in the district include Galt, Oakley, Lodi, Mountain House, and Stockton.[3]
With the redistricting in advance of 2022, the 9th district is still centered on Stockton, but Tracy, Manteca, and Ripon, which were formerly in California's 10th congressional district, are now part of this district, while Antioch, Lathrop and Brentwood are no longer in the district. Antioch and Brentwood are part of the new 10th district, which is now west of the 9th district (as opposed to south).[4] Lathrop will be part of the new 13th district.[5]
The district was one of 13 congressional districts that voted for Donald Trump in the 2024 presidential election while simultaneously electing a Democrat in the 2024 House of Representatives elections.[6]
Recent election results from statewide races
Year | Office | Results[7][8][9] |
---|---|---|
2008 | President | Obama 55% - 45% |
2010 | Governor | Brown 48% - 46% |
Lt. Governor | Maldonado 46% - 42% | |
Secretary of State | Bowen 48% - 43% | |
Attorney General | Cooley 49% - 41% | |
Treasurer | Lockyer 51% - 41% | |
Controller | Chiang 55% - 37% | |
2012 | President | Obama 56% - 44% |
2014 | Governor | Brown 53% - 47% |
2016 | President | Clinton 54% - 41% |
2018 | Governor | Newsom 52% - 48% |
Attorney General | Becerra 54% - 46% | |
2020 | President | Biden 55% - 43% |
2022 | Senate (Reg.) | Padilla 51% - 49% |
Governor | Dahle 52% - 48% | |
Lt. Governor | Underwood Jacobs 51% - 49% | |
Secretary of State | Bernosky 50.3% - 49.7% | |
Attorney General | Hochman 50.5% - 49.5% | |
Treasurer | Guerrero 51% - 49% | |
Controller | Chen 53% - 47% | |
2024 | President | Trump 49% - 48% |
Senate (Reg.) | Garvey 51% - 49% |
Composition
Summarize
Perspective
FIPS County Code[10] | County | Seat | Population |
---|---|---|---|
13 | Contra Costa | Martinez | 1,155,025 |
77 | San Joaquin | Stockton | 789,410 |
99 | Stanislaus | Modesto | 551,430 |
Under the 2020 redistricting, California's 9th congressional district is located between the Sacramento Valley, Gold Country, and the San Joaquin Valley. It encompasses most of San Joaquin County, and parts of Contra Costa and Stanislaus Counties. The area in San Joaquin County includes the cities of Stockton, Tracy, Manteca, Lodi, Ripon, and Escalon; and the census-designated places Mountain House, Terminous, Thornton, Collierville, Woodbridge, Acampo, Dogtown, Lockeford, Victor, Lincoln Village, Morada, Country Club, August, Garden Acres, Kennedy, Taft Mosswood, French Camp, Waterloo, Linden, Peters, Farmington, and Del Rio. The area in Contra Costa County includes the census-designated places Discovery Bay and Byron. The area in Stanislaus County includes the census-designated place Valley Home.
San Joaquin County is split between this district and the 13th district. They are partitioned by Union Pacific, Highway 380, S Tracy Blvd, the California Aqueduct, S Banta Rd, Highway 5, Paradise Cut, S Manthey Rd, Walthall Slough, E West Ripon Rd, Kincaid Rd, Hutchinson Rd, and Stanislaus River.
Contra Costa County is split between this district and the 10th district. They are partitioned by Old River, Italian Slough, Western Farms Ranch Rd, Rankin Rd, Highway J14, Byron Hot Springs Rd, Camino Diablo, Kellogg Creek, Sellers Ave, Brentwood Blvd, Alloro Dr, Ghiggeri Dr, Emilio Dr, Guthrie Ln, Balfour Rd, Chestnut St, Byron Highway, Orwood Rd, Burlington Northern Santa Fe, Werner Dredger Cut, and Rock Slough.
Stanislaus County is split between this district and the 13th district. Lon Dale Rd, Highway J9, Highway J14, River Rock Rd, Lesnini Creek, Sonora Rd, and Stanislaus River.
Cities and CDPs with 10,000 or more people
- Stockton – 320,804
- Tracy – 93,000
- Manteca – 83,498
- Lodi – 67,258
- Mountain House – 24,499
- Ripon – 16,013
- Discovery Bay – 15,385
- Garden Acres – 11,398
- Country Club – 10,777
2,500 – 10,000 people
- August – 8,628
- Escalon – 7,472
- Lincoln Village – 4,401
- Woodbridge – 4,031
- French Camp – 3,770
- Lockeford – 3,521
- Kennedy – 3,256
- Morada – 3,166
- Collierville – 2,698
- Dogtown – 2,643
List of members representing the district
Election results
Summarize
Perspective
1912 • 1914 • 1916 • 1918 • 1920 • 1921 (Special) • 1922 • 1924 • 1926 • 1928 • 1930 • 1932 • 1934 • 1936 • 1938 • 1940 • 1942 • 1944 • 1946 • 1948 • 1950 • 1952 • 1954 • 1956 • 1958 • 1960 • 1962 • 1964 • 1966 • 1968 • 1970 • 1972 • 1974 • 1976 • 1978 • 1980 • 1982 • 1984 • 1986 • 1988 • 1990 • 1992 • 1994 • 1996 • 1998 (Special) • 1998 • 2000 • 2002 • 2004 • 2006 • 2008 • 2010 • 2012 • 2014 • 2016 • 2018 • 2020 • 2022 |
1912
Party | Candidate | Votes | % | ||
---|---|---|---|---|---|
Republican | Charles W. Bell | 28,845 | 47.2 | ||
Democratic | Thomas H. Kirk | 14,571 | 23.9 | ||
Socialist | Ralph L. Criswell | 11,123 | 18.2 | ||
Prohibition | George S. Yarnall | 6,510 | 10.7 | ||
Total votes | 61,049 | 100.0 | |||
Turnout | |||||
Republican win (new seat) |
1914
Party | Candidate | Votes | % | |||
---|---|---|---|---|---|---|
Prohibition | Charles Hiram Randall | 28,097 | 30.9 | |||
Progressive | Charles W. Bell (incumbent) | 27,560 | 30.3 | |||
Republican | Frank C. Roberts | 25,176 | 27.7 | |||
Socialist | Henry A. Hart | 10,084 | 11.1 | |||
Total votes | 90,917 | 100.0 | ||||
Turnout | ||||||
Prohibition gain from Republican |
1916
Party | Candidate | Votes | % | |
---|---|---|---|---|
Prohibition | Charles Hiram Randall (Incumbent) | 58,826 | 57.8 | |
Independent | Charles W. Bell | 33,270 | 32.7 | |
Socialist | Ralph L. Criswell | 9,661 | 9.5 | |
Total votes | 101,757 | 100.0 | ||
Turnout | ||||
Prohibition hold |
1918
Party | Candidate | Votes | % | |
---|---|---|---|---|
Prohibition | Charles Hiram Randall (Incumbent) | 38,782 | 53.0 | |
Republican | Montaville Flowers | 31,689 | 43.3 | |
Socialist | Grace Silver Henry | 2,718 | 3.7 | |
Total votes | 73,189 | 100.0 | ||
Turnout | ||||
Prohibition hold |
1920
Party | Candidate | Votes | % | |||
---|---|---|---|---|---|---|
Republican | Charles F. Van de Water | 62,952 | 59.7 | |||
Prohibition | Charles Hiram Randall (Incumbent) | 36,675 | 34.8 | |||
Socialist | Mary E. Garbutt | 5,819 | 5.5 | |||
Total votes | 105,446 | 100.0 | ||||
Turnout | ||||||
Republican gain from Prohibition |
1921 (Special)
Republican Walter F. Lineberger won the special election to replace fellow Republican Charles F. Van de Water, who won the election but died before the 67th Congress convened. Data for this special election is not available.[12]
1922
Party | Candidate | Votes | % | |
---|---|---|---|---|
Republican | Walter F. Lineberger (Incumbent) | 66,265 | 59.1 | |
Prohibition | Charles Hiram Randall | 45,794 | 40.9 | |
Total votes | 112,059 | 100.0 | ||
Turnout | ||||
Republican hold |
1924
Party | Candidate | Votes | % | |
---|---|---|---|---|
Republican | Walter F. Lineberger (Incumbent) | 119,993 | 63.9 | |
Prohibition | Charles Hiram Randall | 67,735 | 36.1 | |
Total votes | 187,728 | 100.0 | ||
Turnout | ||||
Republican hold |
1926
Party | Candidate | Votes | % | |
---|---|---|---|---|
Republican | William E. Evans (incumbent) | 102,270 | 59.5 | |
Prohibition | Charles Hiram Randall | 61,719 | 35.9 | |
Socialist | Charles F. Conley | 7,943 | 4.6 | |
Total votes | 171,932 | 100.0 | ||
Turnout | ||||
Republican hold |
1928
Party | Candidate | Votes | % | |
---|---|---|---|---|
Republican | William E. Evans (incumbent) | 222,261 | 77.0 | |
Democratic | James B. Ogg | 58,263 | 20.2 | |
Socialist | Christian Sorenson | 8,090 | 2.8 | |
Total votes | 288,614 | 100.0 | ||
Turnout | ||||
Republican hold |
1930
Party | Candidate | Votes | % | |
---|---|---|---|---|
Republican | William E. Evans (incumbent) | 182,176 | 100.0 | |
Turnout | ||||
Republican hold |
1932
Party | Candidate | Votes | % | |||
---|---|---|---|---|---|---|
Democratic | Denver S. Church | 50,125 | 61.6 | |||
Republican | Henry E. Barbour (Incumbent) | 31,209 | 38.4 | |||
Total votes | 81,334 | 100.0 | ||||
Turnout | ||||||
Democratic gain from Republican |
1934
Party | Candidate | Votes | % | |||
---|---|---|---|---|---|---|
Republican | Bertrand W. Gearhart | 77,650 | 100.0 | |||
Turnout | ||||||
Republican gain from Democratic |
1936
Party | Candidate | Votes | % | |
---|---|---|---|---|
Republican | Bertrand W. Gearhart (Incumbent) | 82,360 | 97 | |
Communist | Carl B. Patterson | 2,571 | 3 | |
Total votes | 84,931 | 100 | ||
Turnout | ||||
Republican hold |
1938
Party | Candidate | Votes | % | |
---|---|---|---|---|
Republican | Bertrand W. Gearhart (Incumbent) | 91,128 | 96.3 | |
No party | George H. Sciaroni (write-in) | 3,536 | 3.7 | |
Total votes | 94,664 | 100.0 | ||
Turnout | ||||
Republican hold |
1940
Party | Candidate | Votes | % | |
---|---|---|---|---|
Republican | Bertrand W. Gearhart (Incumbent) | 99,708 | 100.0 | |
Turnout | ||||
Republican hold |
1942
Party | Candidate | Votes | % | |
---|---|---|---|---|
Republican | Bertrand W. Gearhart (Incumbent) | 65,791 | 100.0 | |
Turnout | ||||
Republican hold |
1944
Party | Candidate | Votes | % | |
---|---|---|---|---|
Republican | Bertrand W. Gearhart (Incumbent) | 66,845 | 100.0 | |
Turnout | ||||
Republican hold |
1946
Party | Candidate | Votes | % | |
---|---|---|---|---|
Republican | Bertrand W. Gearhart (Incumbent) | 50,171 | 53.7 | |
Democratic | Hubert Phillips | 43,244 | 46.3 | |
Total votes | 93,415 | 100.0 | ||
Turnout | ||||
Republican hold |
1948
Party | Candidate | Votes | % | |||
---|---|---|---|---|---|---|
Democratic | Cecil F. White | 72,826 | 51.3 | |||
Republican | Bertrand W. Gearhart (Incumbent) | 66,563 | 46.9 | |||
Progressive | Josephine F. Daniels | 2,573 | 1.8 | |||
Total votes | 141,962 | 100.0 | ||||
Turnout | ||||||
Democratic gain from Republican |
1950
Party | Candidate | Votes | % | |||
---|---|---|---|---|---|---|
Republican | Allan O. Hunter | 76,015 | 52 | |||
Democratic | Cecil F. White (incumbent) | 70,201 | 48 | |||
Total votes | 146,216 | 100.0 | ||||
Turnout | ||||||
Republican gain from Democratic |
1952
Party | Candidate | Votes | % | ||
---|---|---|---|---|---|
Republican | J. Arthur Younger (incumbent) | 71,426 | 53.1 | ||
Democratic | Harold F. Taggart | 61,028 | 45.3 | ||
Progressive | Charles S. Brown | 2,140 | 1.6 | ||
Total votes | 134,594 | 100.0 | |||
Turnout | |||||
Republican win (new seat) |
1954
Party | Candidate | Votes | % | |
---|---|---|---|---|
Republican | J. Arthur Younger (incumbent) | 60,648 | 54.5 | |
Democratic | Harold F. Taggart | 50,619 | 45.5 | |
Total votes | 111,267 | 100.0 | ||
Turnout | ||||
Republican hold |
1956
Party | Candidate | Votes | % | |
---|---|---|---|---|
Republican | J. Arthur Younger (incumbent) | 96,388 | 60.3 | |
Democratic | James T. McKay | 63,504 | 39.7 | |
Total votes | 159,892 | 100.0 | ||
Turnout | ||||
Republican hold |
1958
Party | Candidate | Votes | % | |
---|---|---|---|---|
Republican | J. Arthur Younger (incumbent) | 90,735 | 58.8 | |
Democratic | Elma D. Oddstad | 63,597 | 41.2 | |
Total votes | 154,332 | 100.0 | ||
Turnout | ||||
Republican hold |
1960
Party | Candidate | Votes | % | |
---|---|---|---|---|
Republican | J. Arthur Younger (incumbent) | 116,589 | 59.2 | |
Democratic | John D. Kaster | 80,227 | 40.8 | |
Total votes | 196,816 | 100.0 | ||
Turnout | ||||
Republican hold |
1962
Party | Candidate | Votes | % | ||
---|---|---|---|---|---|
Democratic | Don Edwards | 79,616 | 66 | ||
Republican | Joseph F. Donovan | 41,104 | 34 | ||
Total votes | 120,720 | 100 | |||
Turnout | |||||
Democratic win (new seat) |
1964
Party | Candidate | Votes | % | |
---|---|---|---|---|
Democratic | Don Edwards (incumbent) | 115,954 | 69.8 | |
Republican | Joseph F. Donovan | 50,261 | 30.2 | |
Total votes | 166,215 | 100.0 | ||
Turnout | ||||
Democratic hold |
1966
Party | Candidate | Votes | % | |
---|---|---|---|---|
Democratic | Don Edwards (incumbent) | 97,311 | 63.2 | |
Republican | Wilbur G. Durkee | 56,784 | 36.8 | |
Total votes | 154,095 | 100.0 | ||
Turnout | ||||
Democratic hold |
1968
Party | Candidate | Votes | % | |
---|---|---|---|---|
Democratic | Don Edwards (incumbent) | 100,891 | 56.5 | |
Republican | Larry Fargher | 77,521 | 43.5 | |
Total votes | 178,412 | 100.0 | ||
Turnout | ||||
Democratic hold |
1970
Party | Candidate | Votes | % | |
---|---|---|---|---|
Democratic | Don Edwards (incumbent) | 120,041 | 69.1 | |
Republican | Mark Guerra | 49,556 | 28.5 | |
American Independent | Edmon V. Kaiser | 4,009 | 2.3 | |
Total votes | 173,606 | 100.0 | ||
Turnout | ||||
Democratic hold |
1972
Party | Candidate | Votes | % | |
---|---|---|---|---|
Democratic | Don Edwards (incumbent) | 123,837 | 72.3 | |
Republican | Herb Smith | 43,134 | 25.2 | |
American Independent | Edmon V. Kaiser | 4,403 | 2.5 | |
Total votes | 171,374 | 100 | ||
Turnout | ||||
Democratic hold |
1974
Party | Candidate | Votes | % | |
---|---|---|---|---|
Democratic | Pete Stark (incumbent) | 87,854 | 70.6 | |
Republican | Edson Adams | 36,522 | 29.4 | |
Total votes | 124,376 | 100.0 | ||
Turnout | ||||
Democratic hold |
1976
Party | Candidate | Votes | % | |
---|---|---|---|---|
Democratic | Pete Stark (incumbent) | 116,398 | 70.8 | |
Republican | James K. Mills | 44,607 | 27.1 | |
Peace and Freedom | Albert L. Sargis | 3,386 | 2.1 | |
Total votes | 164,391 | 100.0 | ||
Turnout | ||||
Democratic hold |
1978
Party | Candidate | Votes | % | |
---|---|---|---|---|
Democratic | Pete Stark (incumbent) | 88,179 | 65.4 | |
Republican | Robert S. Allen | 41,138 | 30.5 | |
Peace and Freedom | Lawrance J. Phillips | 5,562 | 4.1 | |
Total votes | 134,879 | 100.0 | ||
Turnout | ||||
Democratic hold |
1980
Party | Candidate | Votes | % | |
---|---|---|---|---|
Democratic | Pete Stark (incumbent) | 90,504 | 55.3 | |
Republican | William J. "Bill" Kennedy | 67,265 | 41.1 | |
Libertarian | Steven W. Clanin | 5,823 | 3.6 | |
Total votes | 163,592 | 100.0 | ||
Turnout | ||||
Democratic hold |
1982
Party | Candidate | Votes | % | |
---|---|---|---|---|
Democratic | Pete Stark (incumbent) | 104,393 | 60.7 | |
Republican | William J. "Bill" Kennedy | 67,702 | 39.3 | |
Total votes | 172,095 | 100.0 | ||
Turnout | ||||
Democratic hold |
1984
Party | Candidate | Votes | % | |
---|---|---|---|---|
Democratic | Pete Stark (incumbent) | 136,511 | 69.9 | |
Republican | J. T. "Eager" Beaver | 51,399 | 26.3 | |
Libertarian | Martha Fuhrig | 7,398 | 3.8 | |
Total votes | 195,308 | 100.0 | ||
Turnout | ||||
Democratic hold |
1986
Party | Candidate | Votes | % | |
---|---|---|---|---|
Democratic | Pete Stark (incumbent) | 113,490 | 69.7 | |
Republican | David M. "Dave" Williams | 49,300 | 30.3 | |
Total votes | 162,790 | 100.0 | ||
Turnout | ||||
Democratic hold |
1988
Party | Candidate | Votes | % | |
---|---|---|---|---|
Democratic | Pete Stark (incumbent) | 152,866 | 73 | |
Republican | Howard Hertz | 56,656 | 27 | |
Total votes | 214,522 | 100 | ||
Turnout | ||||
Democratic hold |
1990
Party | Candidate | Votes | % | |
---|---|---|---|---|
Democratic | Pete Stark (incumbent) | 94,739 | 58.4 | |
Republican | Victor Romero | 67,412 | 41.6 | |
Total votes | 162,151 | 100.0 | ||
Turnout | ||||
Democratic hold |
1992
Party | Candidate | Votes | % | |
---|---|---|---|---|
Democratic | Ron Dellums (incumbent) | 164,265 | 71.9 | |
Republican | G. William "Billy" Hunter | 53,707 | 23.5 | |
Peace and Freedom | Dave Linn | 10,472 | 4.6 | |
No party | Muss (write-in) | 23 | 0.0 | |
Total votes | 228,467 | 100.0 | ||
Turnout | ||||
Democratic hold |
1994
Party | Candidate | Votes | % | |
---|---|---|---|---|
Democratic | Ron Dellums (incumbent) | 129,233 | 72.25 | |
Republican | Deborah Wright | 40,448 | 22.61 | |
Peace and Freedom | Emma Wong Mar | 9,194 | 5.14 | |
Total votes | 178,875 | 100.0 | ||
Turnout | ||||
Democratic hold |
1996
Party | Candidate | Votes | % | |
---|---|---|---|---|
Democratic | Ron Dellums (incumbent) | 154,806 | 77.1 | |
Republican | Deborah Wright | 37,126 | 18.5 | |
Peace and Freedom | Tom Condit | 5,561 | 2.7 | |
Natural Law | Jack Forem | 3,475 | 1.7 | |
Republican | Omari Musa (write-in) | 8 | 0.0 | |
Total votes | 200,976 | 100.0 | ||
Turnout | ||||
Democratic hold |
1998 (Special)
Party | Candidate | Votes | % | |
---|---|---|---|---|
Democratic | Barbara Lee | 33,497 | 66.81 | |
Democratic | Greg Harper | 8,048 | 16.05 | |
Republican | Claiborne Sanders | 6,114 | 12.19 | |
Democratic | Randal Stewart | 2,481 | 4.95 | |
Total votes | 50,140 | 100.00 | ||
Turnout | ||||
Democratic hold |
1998
Party | Candidate | Votes | % | |
---|---|---|---|---|
Democratic | Barbara Lee (incumbent) | 140,722 | 82.83 | |
Republican | Claiborne "Clay" Sanders | 22,431 | 13.20 | |
Peace and Freedom | Gerald Sanders | 4,767 | 2.81 | |
Natural Law | Walter Ruehlig | 1,975 | 1.16 | |
Total votes | 169,895 | 100.0 | ||
Turnout | ||||
Democratic hold |
2000
Party | Candidate | Votes | % | |
---|---|---|---|---|
Democratic | Barbara Lee (incumbent) | 182,352 | 85.0 | |
Republican | Arneze Washington | 21,033 | 9.8 | |
Libertarian | Fred E. Foldvary | 7,051 | 3.3 | |
Natural Law | Ellen Jefferds | 4,214 | 1.9 | |
Total votes | 214,650 | 100.0 | ||
Turnout | ||||
Democratic hold |
2002
Party | Candidate | Votes | % | |
---|---|---|---|---|
Democratic | Barbara Lee (incumbent) | 135,893 | 85.0 | |
Republican | Jerald Udinsky | 25,333 | 9.8 | |
Libertarian | James M. Eyer | 5,685 | 3.4 | |
Republican | Hector Reyna (write-in) | 6 | 0.0 | |
Total votes | 166,917 | 100.0 | ||
Turnout | ||||
Democratic hold |
2004
Party | Candidate | Votes | % | |
---|---|---|---|---|
Democratic | Barbara Lee (incumbent) | 215,630 | 84.6 | |
Republican | Claudia Bermudez | 31,278 | 12.3 | |
Libertarian | James M. Eyer | 8,131 | 3.1 | |
Total votes | 255,039 | 100.0 | ||
Turnout | ||||
Democratic hold |
2006
Party | Candidate | Votes | % | |
---|---|---|---|---|
Democratic | Barbara Lee (incumbent) | 167,245 | 86.4 | |
Republican | John "J.D." Den Dulk | 20,786 | 10.7 | |
Libertarian | James M. Eyer | 5,655 | 2.9 | |
Total votes | 193,686 | 100.0 | ||
Turnout | ||||
Democratic hold |
2008
Party | Candidate | Votes | % | |
---|---|---|---|---|
Democratic | Barbara Lee (incumbent) | 238,915 | 86.06 | |
Republican | Charles Hargrave | 26,917 | 9.70 | |
Libertarian | James M. Eyer | 11,704 | 4.22 | |
Total votes | 277,536 | 100.0 | ||
Turnout | ||||
Democratic hold |
2010
Party | Candidate | Votes | % | |
---|---|---|---|---|
Democratic | Barbara Lee (incumbent) | 180,400 | 84.27 | |
Republican | Gerald Hashimito | 23,054 | 10.77 | |
Green | Dave Heller | 4,848 | 2.27 | |
Libertarian | James M. Eyer | 4,113 | 1.92 | |
Peace and Freedom | Larry Allen | 1,670 | 0.78 | |
Total votes | 214,085 | 100.0 | ||
Turnout | ||||
Democratic hold |
2012
Party | Candidate | Votes | % | |
---|---|---|---|---|
Democratic | Jerry McNerney (incumbent) | 118,373 | 55.6 | |
Republican | Ricky Gill | 94,704 | 44.4 | |
Total votes | 213,077 | 100.0 | ||
Democratic hold |
2014
Party | Candidate | Votes | % | |
---|---|---|---|---|
Democratic | Jerry McNerney (incumbent) | 63,475 | 52.4 | |
Republican | Antonio C. Amador | 57,729 | 47.6 | |
Total votes | 121,204 | 100.0 | ||
Democratic hold |
2016
Party | Candidate | Votes | % | |
---|---|---|---|---|
Democratic | Jerry McNerney (incumbent) | 133,163 | 57.4 | |
Republican | Antonio C. Amador | 98,992 | 42.6 | |
Total votes | 232,155 | 100.0 | ||
Democratic hold |
2018
Party | Candidate | Votes | % | |
---|---|---|---|---|
Democratic | Jerry McNerney (incumbent) | 113,414 | 56.5 | |
Republican | Marla Livengood | 87,349 | 43.5 | |
Total votes | 200,763 | 100.0 | ||
Democratic hold |
2020
Party | Candidate | Votes | % | |
---|---|---|---|---|
Democratic | Jerry McNerney (incumbent) | 174,252 | 57.6 | |
Republican | Antonio C. "Tony" Amador | 128,358 | 42.4 | |
Total votes | 302,610 | 100.0 | ||
Democratic hold |
2022
Party | Candidate | Votes | % | |
---|---|---|---|---|
Democratic | Josh Harder (incumbent) | 95,598 | 54.8 | |
Republican | Tom Patti | 78,802 | 45.2 | |
Total votes | 174,400 | 100.0 | ||
Democratic hold |
2024
Party | Candidate | Votes | % | |
---|---|---|---|---|
Democratic | Josh Harder (incumbent) | 130,183 | 51.8 | |
Republican | Kevin Lincoln | 121,174 | 48.2 | |
Total votes | 251,357 | 100.0 | ||
Democratic hold |
See also
References
External links
Wikiwand - on
Seamless Wikipedia browsing. On steroids.