Top Qs
Timeline
Chat
Perspective
Demographics of London
From Wikipedia, the free encyclopedia

Remove ads
The demography of London is analysed by the Office for National Statistics and data is produced for each of the Greater London wards, the City of London and the 32 London boroughs, the Inner London and Outer London statistical sub-regions, each of the Parliamentary constituencies in London, and for all of Greater London as a whole. Additionally, data is produced for the Greater London Urban Area. Statistical information is produced about the size and geographical breakdown of the population, the number of people entering and leaving country and the number of people in each demographic subgroup. The 2021 population of London was 8,799,800.[6]
Remove ads
History
Creation of Greater London: 1965
Through the London Government Act of 1963, the Greater London region was established officially in 1965.[7]
Migration boom: 1991 to today
From 1997 onwards, London has experienced a drastic change in the composition of the city's population, which has off-set the decline of the population which had been occurring.[citation needed] In 1991, 21.7% of the city was foreign born but by 2011 this had risen to 36.7%.
In 2011, a historic tipping point occurred with the release of the 2011 census, indicating that the White British population, which had before been the majority, was now no longer a majority of London's population, although it remained by far the largest single ethnic group.[8]
Remove ads
Population
Summarize
Perspective

The historical population for the current area of Greater London, divided into the statistical areas of Inner and Outer London is as follows:
Age

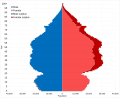
- Population pyramid of each borough in London
 Barking and Dagenham
 Barnet
 Bexley
 Brent
Brent Bromley
 Camden
 City of London
 Croydon
 Ealing
 Enfield
 Hackney
 Greenwich
 Harrow
 Hammersmith and Fulham
 Haringey
 Hillingdon
 Havering
 Hounslow
 Islington
 Kensington and Chelsea
 Kingston upon Thames
 Lambeth
 Lewisham
 Merton
 Newham
 Redbridge
 Richmond upon Thames
 Southwark
 Sutton
 Waltham Forest
 Tower Hamlets
 Wandsworth
 Westminster
- Percentage of the population in age groups
 Under 15s in London
 15 to 64 year olds
 Over 64 years old

_in_London.svg)

Fertility

In 2023, 104,252 live births occurred within London. The fertility rate of London in 2023 was 1.35, which is below replacement.[13]
- Birth statistics in London
 The teenage conception rate in London, 1998 to 2017

Population density

The population density of London was 5,727 per km2 in 2011.[15]
Urban and metropolitan area
At the 2001 census, the population of the Greater London Urban Area was 8,278,251.[16] This area does not include some outliers within Greater London, but extends into the adjacent South East England and East of England regions. In 2004, the London Plan of the Mayor of London defined a metropolitan region with a population of 18 million.[17]
Eurostat has developed a harmonising standard for comparing metropolitan areas in the European Union. The population of the London Larger Urban Zone is 11,917,000. It occupies an area of 8,920 square kilometres (3,440 sq mi). Another definition gives the 2007 population of the metropolitan area as 13,709,000.[18]
Remove ads
Ethnicity
Summarize
Perspective
For the overwhelming majority of London's history, the population of the city was ethnically homogenous with the population being of White British ethnic origin,[19] with small clusters of minority groups such as Jewish people, most notably in areas of the East End. From 1948 onwards and especially since the 1990s, the population has diversified in international terms at an increased rate.[19]
In 2011, it was reported for the first time that White British people had become a minority within London, establishing that London was a majority-minority city within the UK.[8] In 2005, a survey of London's ethnic and religious diversity claimed that there were more than 300 languages spoken, and 50 non-indigenous communities with a population of more than 10,000 in London.[20]
Ethnicity overall


The following table shows the ethnic group of respondents from estimates in 1971 and in the 1991–2021 censuses in Greater London.
- New category created for the 2001 census
- New category created for the 2011 census
- In 2001, listed under the 'Other ethnic group' heading.
Distribution of ethnic groups in Greater London in the 2021 census
 White (2001-2021)
 White-British (2021)
 White-Irish (2021)
 White-Other White (2021)
 Asian (2001-2021)
 Asian-Bangladeshi (2021)
 Asian-Chinese (2021)
 Asian-Indian (2021)
 Asian-Pakistani (2021)
 Black (2001-2021)
 Black-African (2021)
 Black-Caribbean (2021)
 Other-Arab (2021)
 Other-Any Other Ethnic Group (2021)


- Population pyramids of each ethnic group in London
 White: Total
 White British
 White Irish
 White Other
 Asian: Total
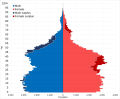 Asian Bangladeshi
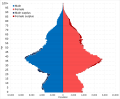 Asian Indian
 Asian Pakistani
 Asian Chinese
 Other Asian
 Black: Total
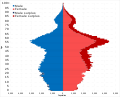 Black: Caribbean
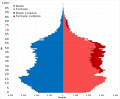 Black: African
 Other Black
 Mixed: Total
 Other: Total
 Other: Any other ethnic group
 Other: Arabs


Ethnicity of school pupils
- School pupils as a percentage of the school population in each borough in 2021/2022 school year
 White: Total
 White: British


Ethnicity of births
- Ethnicity of births as a percentage of total births in 2021
 White (49.6% including Not stated)
 White: British (24.9% including Not stated)
 Asian (22.1%)
 Black (12.2%)
 Mixed (11.3%)


Ethnicity in boroughs
This table shows the proportion of different multi-ethnic groups by London borough, as found in the 2021 census.
Detailed Race and Ethnicity by borough (2021 Census):
- White multi-ethnic group over time
 1991 (79.8%)
 2001 (71.2%)
 2011 (59.8%)
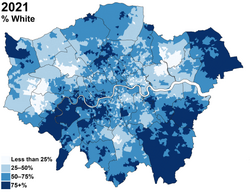 2021 (53.8%)


- Asian multi-ethnic group over time
 1991 (10.3%)
 2001 (13.2%)
 2011 (18.5%)
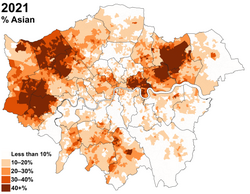 2021 (20.8%)


- Black multi-ethnic group over time
 1991 (8%)
 2001 (10.9%)
 2011 (13.3%)
 2021 (13.5%)


Remove ads
Country of birth
Summarize
Perspective


The 2021 census recorded that 3,575,740 people or 40.7% of London's population are foreign-born, including 27.9% born in a non-European country.[37]
NOTE: The sub-categories included for each continent may not add up to their respective total amount because the sub categories are only supposed to show the most numerous country of birth from said area.
- Foreign born in the County of London (excluding Irish born in images)
 1901 (5% overall including Irish born)
 1911 (5% overall including Irish born)
 1921 (4% overall including Irish born)
 1931 (5% overall including Irish born)
 1951 (8% overall including Irish born)


- Foreign born in London over time
 1961 (9.8%)
 1971 (15.3%)
 1981 (18.2%)
 1991 (21.7%)
 2001 (27.1%)
 2011 (36.7%)
 2021 (40.7%)


- Born to foreign born mothers
 2007
2007 2014
2014 2021
2021


- Population pyramids of country of birth groupings in 2021
 UK born
 Foreign born: Total


Remove ads
Languages
Summarize
Perspective

In the 2011 Census, 6,083,420 or 77.9% of London's population aged 3 and over spoke English as a main language. A further 1,406,912 (19.8%) spoke it as a second language, or well to very well.[47] 271,693 (3.5%) could not speak English well, while 47,917 (0.6%) could not speak English at all.[47]
2,456 (<0.1%) spoke other UK minority languages, with the most common being Welsh and 2,926 (<0.1%) used British Sign Language.[48] This shows great challenges for TfL and other government services. For example most ticket vending machines use only English, French and up to 2 other western Europe hemisphere languages, while as shown below most demand is for Indian languages, Polish, etc.
The most common main languages spoken in Greater London in the 2011 and 2021 censuses are shown below.[49]
Main language
Proficiency in English
Remove ads
Religion
Summarize
Perspective

In 2001, Christians were the majority of London's population, at 58.23%. In 2021, the Christian percentage was 40.66%. The population identifying with no religion rose from 15.76% in 2001, to 27.05% in 2021. This shift suggests a growing trend of secularization in London.[citation needed]
The Muslim population increased from 8.46% in 2001, to 14.99% in 2021. The number of individuals who chose not to state their religion fell from 8.66% in 2001, to 7.00% in 2021.
Hindu's were 4.07% of the population in 2001, and were 5.15% in 2021. The Jewish community were 2.09% in 2001, and 1.65% in 2021. Sikhs were 1.45% in 2001, and 1.64% in 2021. Other religions, including Buddhism, collectively accounted for small but fluctuating percentages, with Buddhism specifically ranging from 0.76% in 2001, to 0.88% in 2021.
These changes are influenced by factors including immigration, generational attitudes, and broader social trends.[citation needed]
Distribution of religions in Greater London according to the 2011 census.
 Christianity
 Islam
Islam Hinduism
 Judaism
 Sikhism
 Buddhism
 Other religion
 No religion


- Population pyramids of each religious group in London
 Christian
 No religion
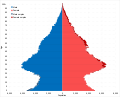 None stated
 Muslim
 Hindu
Hindu Buddhist
 Sikh
Sikh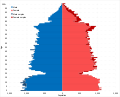 Jewish
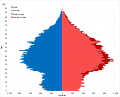 Other religion


Ethnicity by religion
- New category created for the 2011 census
Remove ads
Social issues
Marriage and divorce
In 2019, 29,139 marriages occurred within London.[57]
Abortion
In 2020, 27.7% of conceptions were aborted in London.[58]
- Abortion in London
 The percentage of conceptions aborted in London by each borough in 2020
 Abortion rates by age group in London


Sexual orientation and gender identity
Remove ads
Health
In 2021, the suicide rate in total was 6.6 for every 100,000 people.[61] For males it was 9.9 and for females it was 3.4.[61]
- Variety of health issues in graphs
 Suicide rates in London
 Drug misuse rate in London
 Percentage of Year 6s obese in 2020 in London
 Percentage of Reception age children obese in 2020


General health
Disability
Remove ads
Income and industry
Summarize
Perspective
In 2022, the vast majority of people within London worked in the service sector.[69]
- Income and industry of London in images
 Employment rate in London
 Unemployment rate in London
 Gross Disposable Household Income (GDHI) across London in 2020
 Employment in public or private sector in London


Industry

Method of transportation to work
Note: The proportion of people working from home in 2021 was distorted by the rules surrounding the COVID-19 pandemic.
Hours worked weekly
Distance to travel to work
Note: The proportion of people working from home in 2021 was distorted by the rules surrounding the COVID-19 pandemic.
Remove ads
National identity

Note: The order of options for the census question on national identity was changed between 2011 and 2021. In 2011 "English only" was the first group listed whereas in 2021 "British only" was first instead.[90]
- Population pyramids of identity groupings in 2021
 English only identity
 English and British identity
 British only identity
 UK and non-UK identity
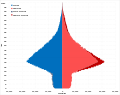 Non-UK only identity


Remove ads
Housing
Tenure in London according to the 2021 census

Owned household: Total (46.8%)

Privately rented (30%)

Socially rented (23.1%)
Tenure by country of birth
Remove ads
Education
Level of qualification
See also
- Demographics of the United Kingdom
- Demographics of England
- Demographics of Birmingham
- Demographics of Greater Manchester
- Religion in London
- Religion in England
- List of English cities by population
- List of English districts by population
- List of English districts and their ethnic composition
- List of English districts by area
- List of English districts by population density
References
Wikiwand - on
Seamless Wikipedia browsing. On steroids.
Remove ads