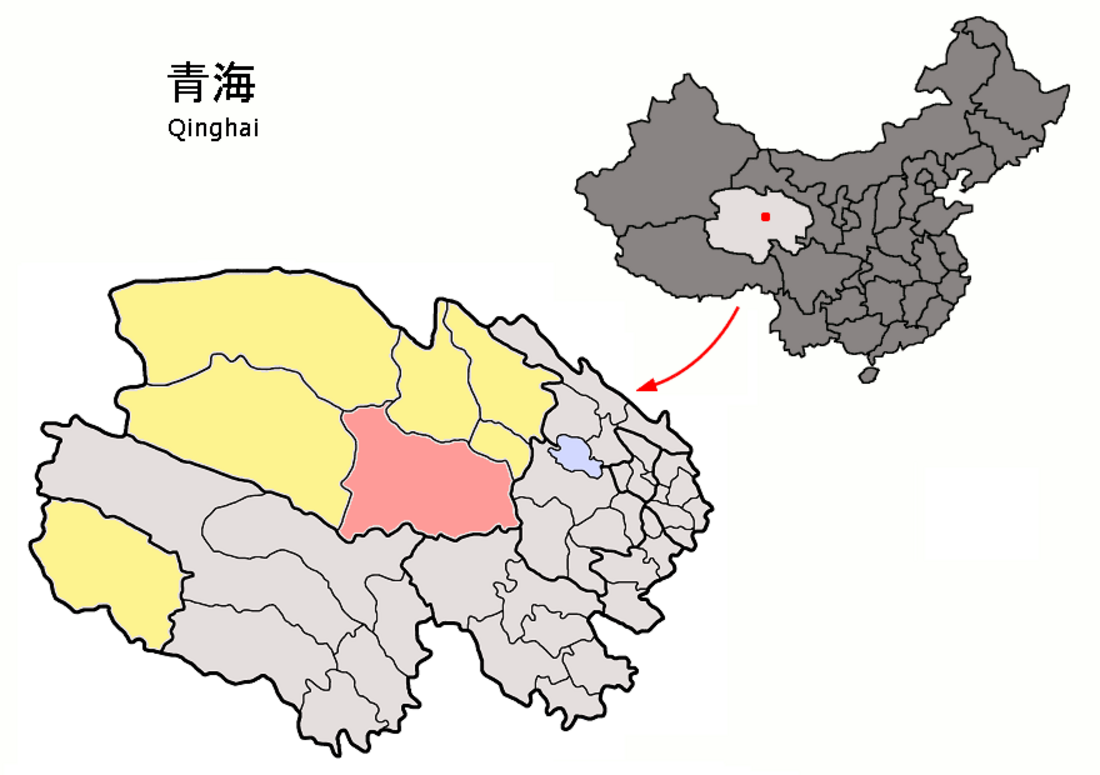
With an elevation of around 3,200 metres (10,000 ft), Dulan County has a subalpine semi-arid climate (Köppen BSk), with long, very cold and winters, and warm summers. Average low temperatures are below freezing from early/mid October to mid/late April; however, due to the wide diurnal temperature variation, only December and January have an average high that is below freezing. With monthly percent possible sunshine ranging from 60% in July to 81% in November, the county seat is very sunny, receiving 3,092 hours of bright sunshine annually; relative humidity in all months is below 50% and is for seven months below 40%. The monthly 24-hour average temperature ranges from −9.6 °C (14.7 °F) in January to 15.2 °C (59.4 °F) in July, while the annual mean is 3.41 °C (38.1 °F). Over 70% of the annual precipitation of 218 mm (8.58 in) is delivered from May to August.
More information Climate data for Dulan County, elevation 3,189 m (10,463 ft), (1991–2020 normals, extremes 1971–2010), Month ...
| Climate data for Dulan County, elevation 3,189 m (10,463 ft), (1991–2020 normals, extremes 1971–2010) |
| Month |
Jan |
Feb |
Mar |
Apr |
May |
Jun |
Jul |
Aug |
Sep |
Oct |
Nov |
Dec |
Year |
| Record high °C (°F) |
11.7
(53.1) |
15.9
(60.6) |
20.0
(68.0) |
27.1
(80.8) |
28.0
(82.4) |
28.9
(84.0) |
31.8
(89.2) |
32.2
(90.0) |
30.3
(86.5) |
23.3
(73.9) |
16.1
(61.0) |
11.5
(52.7) |
32.2
(90.0) |
| Mean daily maximum °C (°F) |
−2.0
(28.4) |
1.6
(34.9) |
6.1
(43.0) |
12.0
(53.6) |
16.2
(61.2) |
19.4
(66.9) |
22.0
(71.6) |
21.8
(71.2) |
17.5
(63.5) |
10.6
(51.1) |
4.4
(39.9) |
−0.6
(30.9) |
10.8
(51.4) |
| Daily mean °C (°F) |
−9.4
(15.1) |
−5.5
(22.1) |
−0.6
(30.9) |
5.1
(41.2) |
9.5
(49.1) |
13.0
(55.4) |
15.3
(59.5) |
14.8
(58.6) |
10.3
(50.5) |
3.3
(37.9) |
−3.1
(26.4) |
−8.1
(17.4) |
3.7
(38.7) |
| Mean daily minimum °C (°F) |
−14.7
(5.5) |
−11
(12) |
−6.1
(21.0) |
−1.1
(30.0) |
3.0
(37.4) |
6.9
(44.4) |
9.4
(48.9) |
8.7
(47.7) |
4.5
(40.1) |
−2.0
(28.4) |
−8.0
(17.6) |
−13.2
(8.2) |
−2.0
(28.4) |
| Record low °C (°F) |
−26.4
(−15.5) |
−22.2
(−8.0) |
−18.1
(−0.6) |
−12.6
(9.3) |
−6.7
(19.9) |
−1.3
(29.7) |
0.6
(33.1) |
0.2
(32.4) |
−4.8
(23.4) |
−12.6
(9.3) |
−18.8
(−1.8) |
−25.7
(−14.3) |
−26.4
(−15.5) |
| Average precipitation mm (inches) |
4.2
(0.17) |
5.8
(0.23) |
7.6
(0.30) |
9.1
(0.36) |
31.1
(1.22) |
51.7
(2.04) |
57.5
(2.26) |
29.2
(1.15) |
19.3
(0.76) |
5.9
(0.23) |
5.2
(0.20) |
2.5
(0.10) |
229.1
(9.02) |
| Average precipitation days (≥ 0.1 mm) |
4.3 |
3.8 |
4.5 |
3.9 |
7.4 |
10.6 |
11.4 |
8.6 |
6.1 |
2.8 |
2.6 |
3.2 |
69.2 |
| Average snowy days |
5.6 |
5.4 |
6.4 |
4.9 |
3.8 |
0.6 |
0.1 |
0 |
0.3 |
2.9 |
3.6 |
4.3 |
37.9 |
| Average relative humidity (%) |
41 |
36 |
33 |
30 |
37 |
48 |
51 |
47 |
45 |
37 |
37 |
38 |
40 |
| Mean monthly sunshine hours |
225.1 |
213.5 |
247.1 |
268.5 |
269.6 |
246.8 |
254.9 |
258.6 |
242.4 |
264.7 |
238.8 |
227.6 |
2,957.6 |
| Percentage possible sunshine |
72 |
69 |
66 |
68 |
62 |
57 |
58 |
62 |
66 |
77 |
79 |
76 |
68 |
| Source: China Meteorological Administration[2][3][4] |
Close
More information Climate data for Nuomuhong, Dulan (1991–2020 normals), Month ...
| Climate data for Nuomuhong, Dulan (1991–2020 normals) |
| Month |
Jan |
Feb |
Mar |
Apr |
May |
Jun |
Jul |
Aug |
Sep |
Oct |
Nov |
Dec |
Year |
| Mean daily maximum °C (°F) |
−0.5
(31.1) |
4.5
(40.1) |
9.8
(49.6) |
15.9
(60.6) |
20.5
(68.9) |
24.1
(75.4) |
26.5
(79.7) |
25.9
(78.6) |
21.5
(70.7) |
14.3
(57.7) |
6.5
(43.7) |
0.4
(32.7) |
14.1
(57.4) |
| Daily mean °C (°F) |
−8.9
(16.0) |
−4.1
(24.6) |
1.6
(34.9) |
7.8
(46.0) |
12.6
(54.7) |
16.4
(61.5) |
18.5
(65.3) |
17.5
(63.5) |
12.9
(55.2) |
5.3
(41.5) |
−2.4
(27.7) |
−8.0
(17.6) |
5.8
(42.4) |
| Mean daily minimum °C (°F) |
−15.4
(4.3) |
−11.1
(12.0) |
−5.6
(21.9) |
0.3
(32.5) |
5.2
(41.4) |
9.5
(49.1) |
11.8
(53.2) |
10.9
(51.6) |
6.4
(43.5) |
−1.5
(29.3) |
−8.9
(16.0) |
−14.4
(6.1) |
−1.1
(30.1) |
| Average precipitation mm (inches) |
1.1
(0.04) |
0.7
(0.03) |
0.8
(0.03) |
1.4
(0.06) |
7.5
(0.30) |
14.0
(0.55) |
12.8
(0.50) |
7.5
(0.30) |
4.9
(0.19) |
0.6
(0.02) |
0.3
(0.01) |
0.5
(0.02) |
52.1
(2.05) |
| Average precipitation days (≥ 0.1 mm) |
1.9 |
0.8 |
1.2 |
0.9 |
2.9 |
5.3 |
6.3 |
4.5 |
3.2 |
0.7 |
0.7 |
0.8 |
29.2 |
| Average snowy days |
2.8 |
1.9 |
2.6 |
1.3 |
0.7 |
0 |
0 |
0 |
0 |
0.6 |
1.4 |
1.3 |
12.6 |
| Average relative humidity (%) |
39 |
30 |
26 |
24 |
29 |
39 |
44 |
41 |
39 |
33 |
34 |
38 |
35 |
| Mean monthly sunshine hours |
223.8 |
220.3 |
264.6 |
284.0 |
288.3 |
262.7 |
267.3 |
264.7 |
244.4 |
259.3 |
243.9 |
227.1 |
3,050.4 |
| Percentage possible sunshine |
72 |
71 |
71 |
72 |
66 |
60 |
61 |
64 |
67 |
76 |
81 |
76 |
70 |
| Source: China Meteorological Administration[5][6] |
Close


