Top Qs
Timeline
Chat
Perspective
List of sovereign states by research and development spending
From Wikipedia, the free encyclopedia
Remove ads
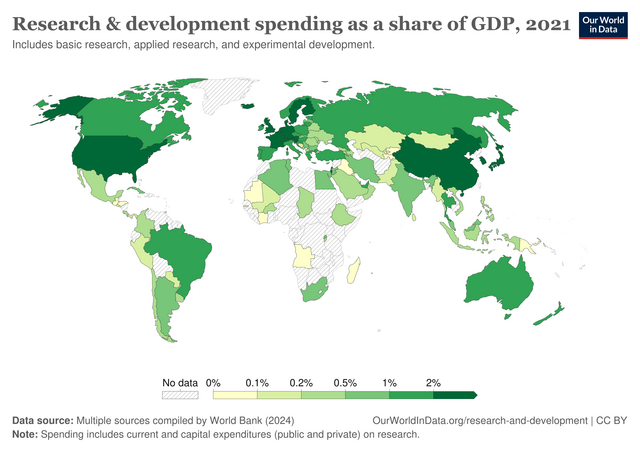
This is a list of countries by research and development (R&D) spending in real terms, based on data published by the World Bank, the United Nations Economic Commission for Europe and the Organisation for Economic Co-operation and Development (OECD).


|
$2000-$2249
$1750-$1999
$1500-$1749
$1250-$1499
$1000-$1249 |
$750-$999
$500-$749
$250-$499
$0-$249
No data |
Remove ads
Definition
According to the World Bank: “Gross domestic expenditures on research and development (R&D) include both capital and current expenditures in the four main sectors: Business enterprise, Government, Higher education and Private non-profit. R&D covers basic research, applied research and experimental development.”[3]
According to the United Nations Economic Commission for Europe: “Research and development (R&D) expenditure as a proportion of Gross Domestic Product (GDP) is defined as the total intramural expenditure on research and experimental development (R&D) performed in the national territory during a specific reference period expressed as a percentage of national gross domestic product (GDP).”[4]
According to the Organisation for Economic Co-operation and Development: “Gross domestic spending on R&D is defined as the total expenditure (current and capital) on R&D carried out by all resident companies, research institutes, universities and government laboratories, etc., in a country. It includes R&D funded from abroad, but excludes domestic funds for R&D performed outside the domestic economy.”[2]
Remove ads
List
Summarize
Perspective
The following table provides information on R&D spending, based on data published by the World Bank,[5] the United Nations Economic Commission for Europe[6] and the Organisation for Economic Co-operation and Development.[2] The indicator is measured in USD constant prices using the 2015 base year and purchasing power parities (PPPs) by OECD and as percentage of GDP. As of 2022, Israel leads the world in R&D spending as a percentage of GDP, followed by South Korea, the United States, Japan, Belgium and Sweden.
Remove ads
See also
- Business R&D intensity by country
- List of companies by research and development spending
- List of countries by number of scientific and technical journal articles
- List of countries by number of scientists and researchers
- List of U.S. states by research and development spending
- Science of science policy
- Science policy
- Tertiary education#Statistics
References
Wikiwand - on
Seamless Wikipedia browsing. On steroids.
Remove ads
